Bitcoin Forming A Bullish Patter on the H4 Time-Frame Chart
Cryptocurrencies have been on the slide today, with Bitcoin losing more than $1,000 from top to bottom. Although, things might be changing.

Cryptocurrencies have been on the slide today, with Bitcoin losing more than $1,000 from top to bottom. Although, things might be changing as I speak. Bitcoin is off the lows and I is heading for the highs of the day.
We still have to cover some ground until we reach today’s high, which comes at $15,273. There’s still about 3-5 hours left until the day comes to an end; who knows, we might even close above the daily open.
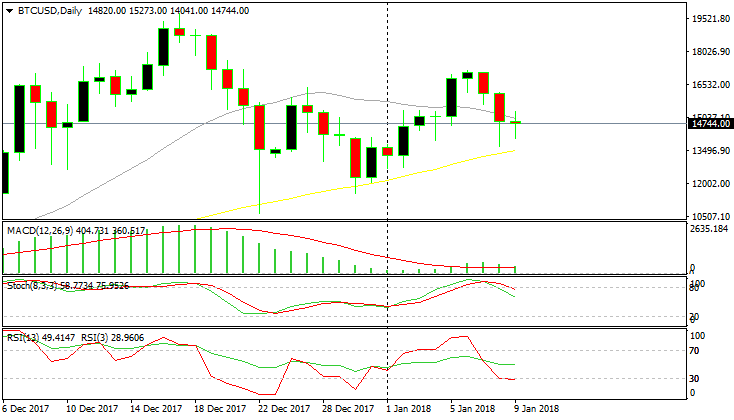
The daily candlestick is forming a doji
But even if the day closes as it is now, the daily candlestick will close as a doji. As many times as I’ve said it today, I’ll say it again because it is an important technical indicator; the doji is a strong reversing signal after a downtrend. That doji comes after two bearish daily candlesticks, which can be considered a downtrend.
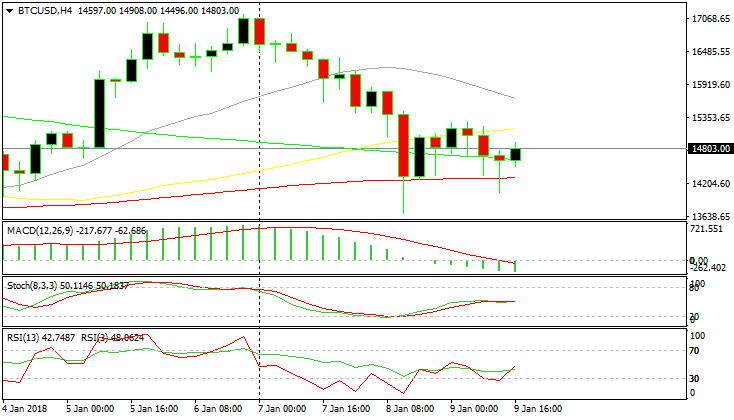
Although, we are looking at the H4 chart and the bullish pattern here looks stronger. On this timeframe chart, you can see the 100 SMA (red) near today’s low. The sellers have tried twice to break below it but the buyers have pushed back up. So, this moving average has turned into a strong support now.
The 100 SMA held again today
Besides that, the previous H4 candlestick closed as a hammer/pin. Just like the doji, the hammers and pins are reversing signals. So, that candlestick is signalling a trend reversal. This makes it two bullish charts in different timeframes. We’re just holding to our long term buy signal in Bitcoin.
- Check out our free forex signals
- Follow the top economic events on FX Leaders economic calendar
- Trade better, discover more Forex Trading Strategies
- Open a FREE Trading Account
- Read our latest reviews on: Avatrade, Exness, HFM and XM
Related Articles


Sidebar rates
Related Posts
