Litecoin (LTC), Ethereum (ETH) Showing Bullish Reversing Signals
The support seems to have held for Litecoin LTC and Ethereum ETH and now they are reversing higiher

Cryptocurrencies have had a tough month during most of November, giving back most of the gains made in October, when the sentiment turned quite positive in the crypto market. The US is trying to tax cryptocurrencies, while India is cracking down together with China, which has turned the sentiment negative this month. Although, we are seeing signs now indicating that the retreat might be over for digital currencies, with Ethereum leading again in the recent days. So, let’s have a look how Ethereum and Litecoin look like on the larger charts.
Litecoin Weekly Chart Analysis – Will MAs Hold As Support?

LTC has moved above $200 today
Litecoin turned bullish suddenly earlier this month, as it pushed ahead with the Visa partnership to bring forth the Litecoin Visa debit card. This will help increase LTC transactions further, since Litecoin will now be accepted anywhere Visa is accepted. LTC/USD surged from around $200 to almost $300.
Although, the bearish sentiment in the crypto market pulled down LTC as well, pushing the price below $200. Although, moving averages seem to be holding as support for now. The 20 SMA (gray) and the 50 SMA (yellow) are standing around $185 and now the price has climbed above $200 again. The sentiment in the crypto market is improving too, so if that continues, then LTC should resume the bullish trend. We are keeping our LTC/USD buy signal open by the way, hoping that December might be a bullish month.
Ethereum Weekly Chart Analysis – Doji Indicates A Bullish Reversal
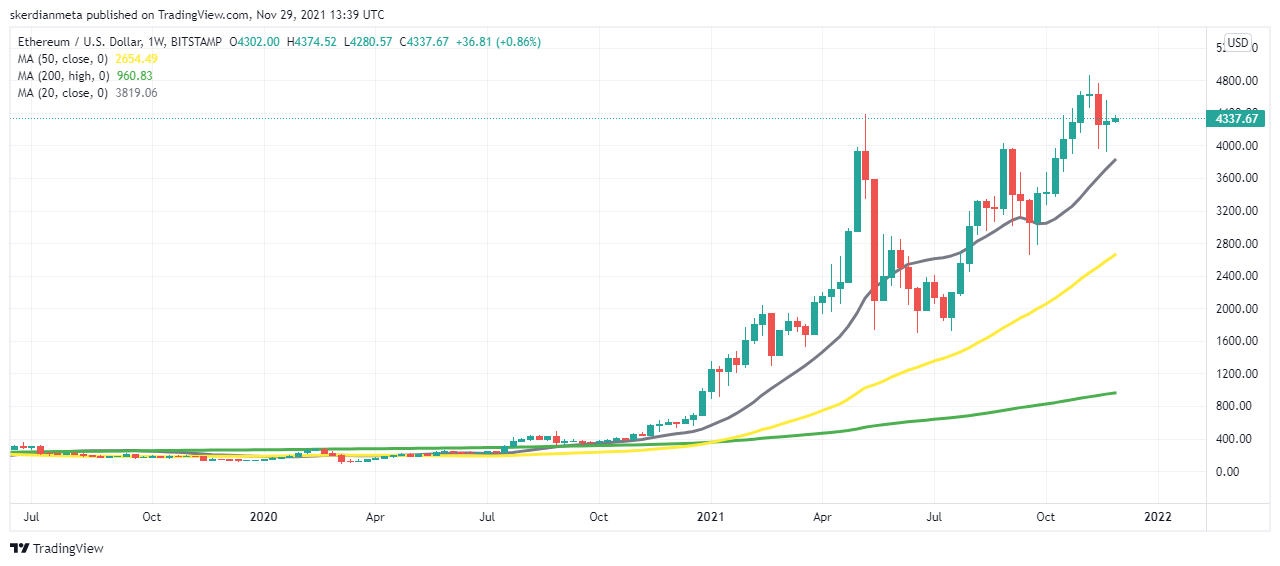
ETH/USD continues to be on an uptrend in the larger charts
Ethereum has had a great year so far in 2021. After the surge in the first several months, Ethereum retreated together with the crypto market in May/June, but had a great run in August. In September we saw another retreat while October was a great month for ETH/USD , as the price moved above May’s high, to print a new all-time high close to $5,000.
But, the price formed a doji candlestick at the top two weeks ago, which is a bearish reversing signal and in the next week, we saw a retreat. Last week’s candlestick closed as a doji again, this time at the bottom after the retrace down, which is a bullish reversing signal. Besides that, the $4,000 level seems to have held as support despite being pierced so we are holding our buy signal here as well, which we opened last week.
Ethereum (ETH) Live Chart
- Check out our free forex signals
- Follow the top economic events on FX Leaders economic calendar
- Trade better, discover more Forex Trading Strategies
- Open a FREE Trading Account
- Read our latest reviews on: Avatrade, Exness, HFM and XM
Related Articles


Sidebar rates
Related Posts
