Bitcoin Symmetrical Triangle Pattern – BTC Struggles Under $30K
Bitcoin began a new uptrend from the $28,500 support level against the US dollar. If there is a clear move above the $30,600 resistance zone
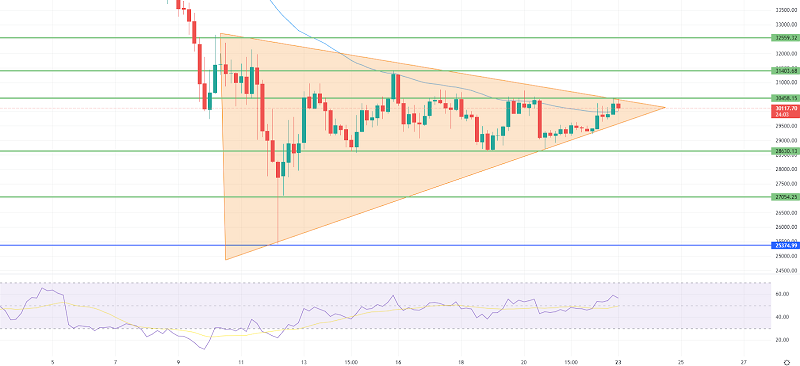
Bitcoin began a new uptrend from the $28,500 support level against the US dollar. If there is a clear move above the $30,600 resistance zone, BTC could rally. BITCOIN climbed higher after forming a double bottom pattern near $28,500. The price is currently trading above the $30,000 level and the 100 hourly simple moving average.
On the hourly chart of the BTC/USD pair, a key bullish trend line is forming with support near $29,800. If there is a clear move above $30,600, the pair could gain bullish momentum.
Bitcoin’s Price May Soon Rise
Bitcoin’s price has remained well above the $28,500 support level. However, before the price began to rise again, it appears that a double bottom pattern formed above $28,500.
The price broke through the $29,500 resistance zone and the 100 hourly simple moving average. The price has even risen above the $30,000 resistance level. On the other hand, the bears are still active near the $30,600 resistance level.
The price reached as high as $30,500 before correcting lower. The price fell below the 23.6 percent Fib retracement level of the upward move from the swing low of $29,225 to the high of $30,500.
On the hourly chart of the BTC/USD pair, a key bullish trend line is forming with support near $29,800. Currently, it is trading above the $30,000 mark and above the 100 hourly simple moving average. Near the $30,450 level, there is immediate resistance. The next major resistance is around $30,600.
A clear break above the $30,450 and $30,600 resistance levels could kick off a strong rally in the near term. The next major resistance level could be near $31,500, after which the price could rise to $32,500.
Bitcoin Price Drop?
If Bitcoin fails to break through the $30,600 resistance level, it may begin a new decline. On the downside, there is immediate support near the $30,000 level. The first significant support is located near the $29,850 level and the trend line.
The trend line is close to the 50% Fib retracement level of the upward move from the swing low of $29,225 to the high of $30,500. A clear break below the trend line could decrease the price to the $28,500 support level. Good luck!
- Check out our free forex signals
- Follow the top economic events on FX Leaders economic calendar
- Trade better, discover more Forex Trading Strategies
- Open a FREE Trading Account
- Read our latest reviews on: Avatrade, Exness, HFM and XM
Related Articles


Sidebar rates
Related Posts
