WTI: Crude Oil Day Intraday Rally Turns South – Weekend Risk May Send Market Higher Next Week
The market got off to a strong start in today’s session, with WTI rallying almost $2 per barrel. But the sentiment changed during the New Yo
The market got off to a strong start in today’s session, with WTI rallying almost $2 per barrel. But the sentiment changed during the New York session pushing the market lower, for a small gain on today’s open.
Baker Hughes published their weekly rig count today. Oil rigs dropped by two, from 508 to 506, Compared to the same time last year the rig count is down by 84 rigs. There’s more than one way of reading this data.
Usually, the market considers that a lower number of rigs means production will decrease. In today’s market we can see that traders and investors read this number differently. The market sentiment today read a weaker demand into the reason.
Presumably production is causing a backlog of stocks and oil drillers are cutting back. Looking at the weekly data published by the EIA we see that just in their last report crude inventories jumped from 3.21 million barrels to 5.841 million.
It may take a larger commitment by OPEC+ countries to further reduce production for crude inventories to decrease. The next OPEC+ meeting will be sometime in June, so we won’t be expecting any coordinated action from the group until then.
The weekend risk could send prices higher already on Monday. I’m considering more supply attacks in the Red Sea, or geopolitical events in the middle east. All factors that have recently helped push crude prices higher.
Technical View
The day chart for WTI below shows a bullish picture, with the market rallying sharply after the breakout of the triangle pattern (yellow area) back in March. However, today’s candle looks set to create an upside-down hammer.
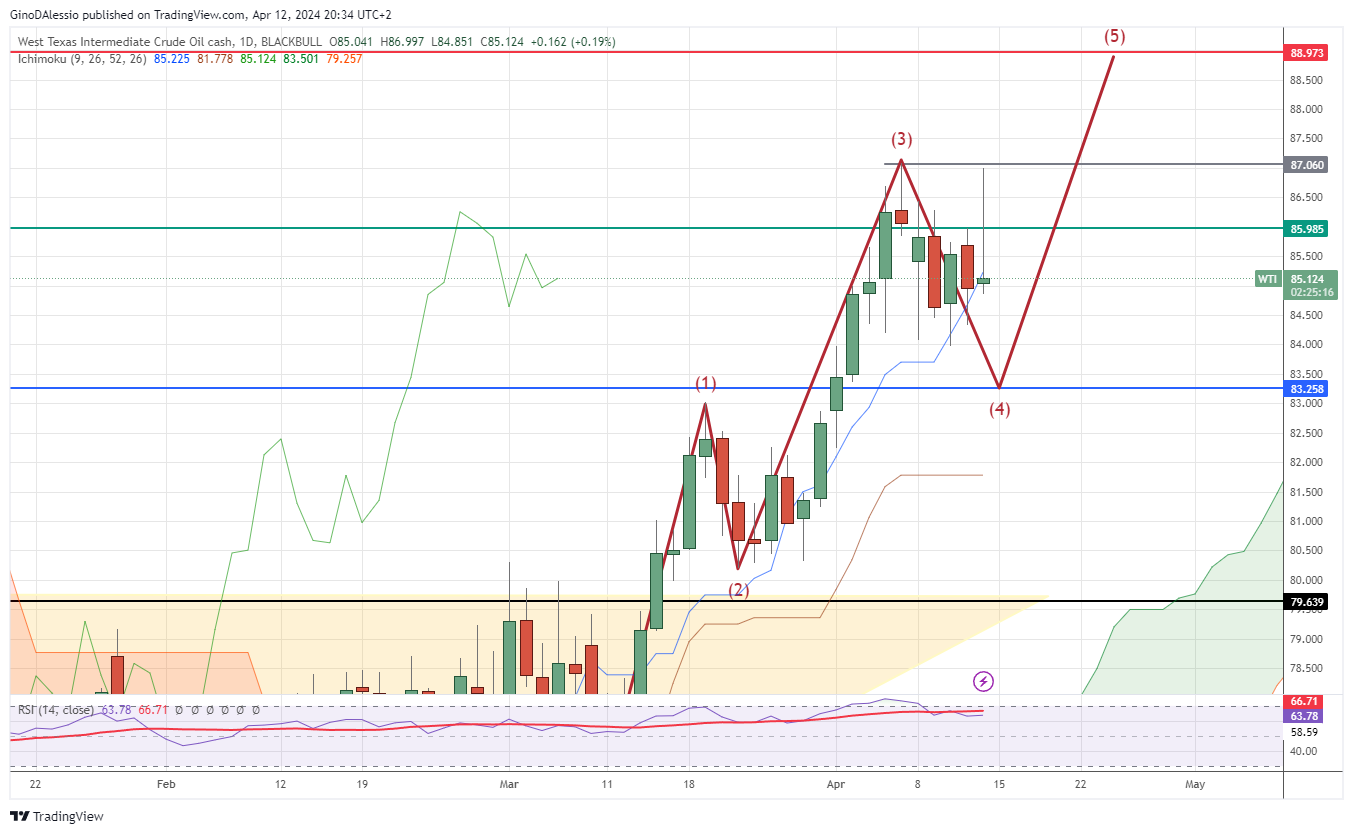
This single candle chart formation is usually accurate on the day chart at predicting a change in direction. How extended the change might be will then depend on many other factors. But we’re looking at this level as being the start of a minor correction.
I expect it to be a minor correction judging by the Elliot Wave count (crimson line). As we can see from the chart, the current trend has only completed the 3rd wave. The market is currently still in the 4th wave. And today’s market looks like a signal for lower prices.
If today’s candle does trigger a correction, I see the next support level (blue line) at $83.25, set back in November 2023. While the next rally, the 5th Elliot wave, should find resistance at the $88.97 level.
- Check out our free forex signals
- Follow the top economic events on FX Leaders economic calendar
- Trade better, discover more Forex Trading Strategies
- Open a FREE Trading Account
- Read our latest reviews on: Avatrade, Exness, HFM and XM
Related Articles


Sidebar rates
Related Posts
