S&P500, NASDAQ and DJIA Price Forecast: Ready For A Correction?
S&P 500 (SPX): Potential Correction on the Horizon?
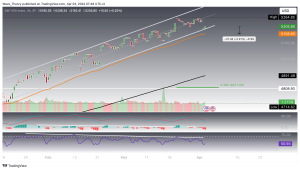
Despite recent bearish pressure over the Eastern holidays, the S&P 500 (SPX) has maintained its position within an upward trend channel. A critical moment approaches as we watch the channel’s support; a breach here could see the index seeking solace around the 50-4h EMA, marked at approximately 5,159.
Should this layer of support falter, the SPX is poised to test its resilience at the next significant safety net: the 200-4h EMA located at 4,891.5, closely followed by the Fibonacci retracement level of 0.382 at 4,817.
Current indicators accentuate the bears’ growing influence, highlighted by a developing bearish divergence and a worrying shift in the MACD histogram, paired with a bearish crossover in the MACD lines within the 4-hour chart. This confluence of signals suggests that caution is warranted, with a closer eye on support levels for potential breaches indicating a deeper correction.
Nasdaq Composite Index (IXIC): Bearish Undercurrents?
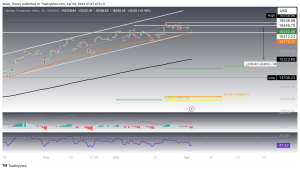
Navigating within an upward channel, the Nasdaq Composite (IXIC) is currently testing its mettle against the channel support at the pivotal 50-4H EMA. A successful defense of this level could propel the index towards a formidable resistance zone stretching from 15,450 to 16,539.
Failure to hold above could see the index descending towards the 200-4H EMA positioned at 15,324. The bearish cross in the MACD lines, coupled with a declining MACD histogram, paints a cautious narrative. Meanwhile, the RSI offers no clear directional bias, leaving traders parsing through mixed signals.
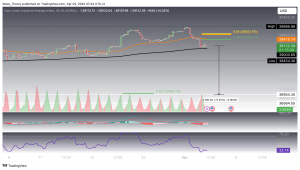
DJIA (US30): Bracing for a Bounce or Break?
- Check out our free forex signals
- Follow the top economic events on FX Leaders economic calendar
- Trade better, discover more Forex Trading Strategies
- Open a FREE Trading Account
- Read our latest reviews on: Avatrade, Exness, HFM and XM
Related Articles
Sidebar rates
