Bitcoin Stuck in a Tight Range as Market Awaits Next Move
Bitcoin (BTC) has been trading sideways between $65,300 and $68,400 for nearly ten days, with the all-time high of around $69,000 proving to
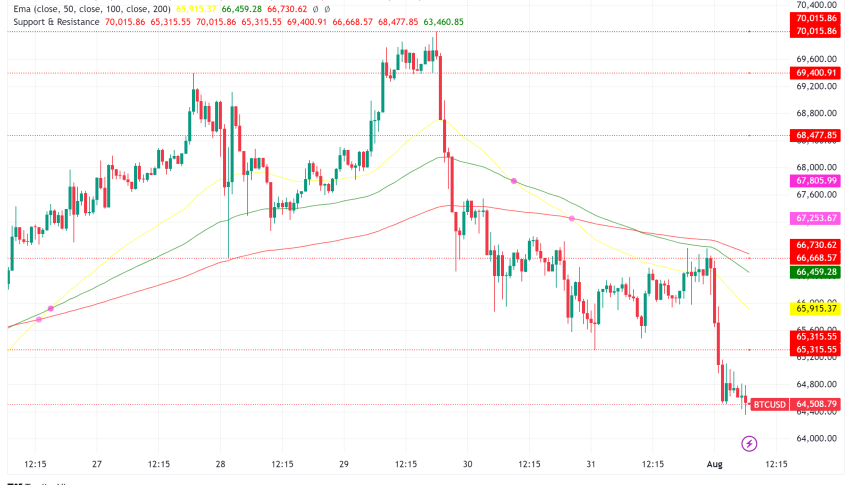
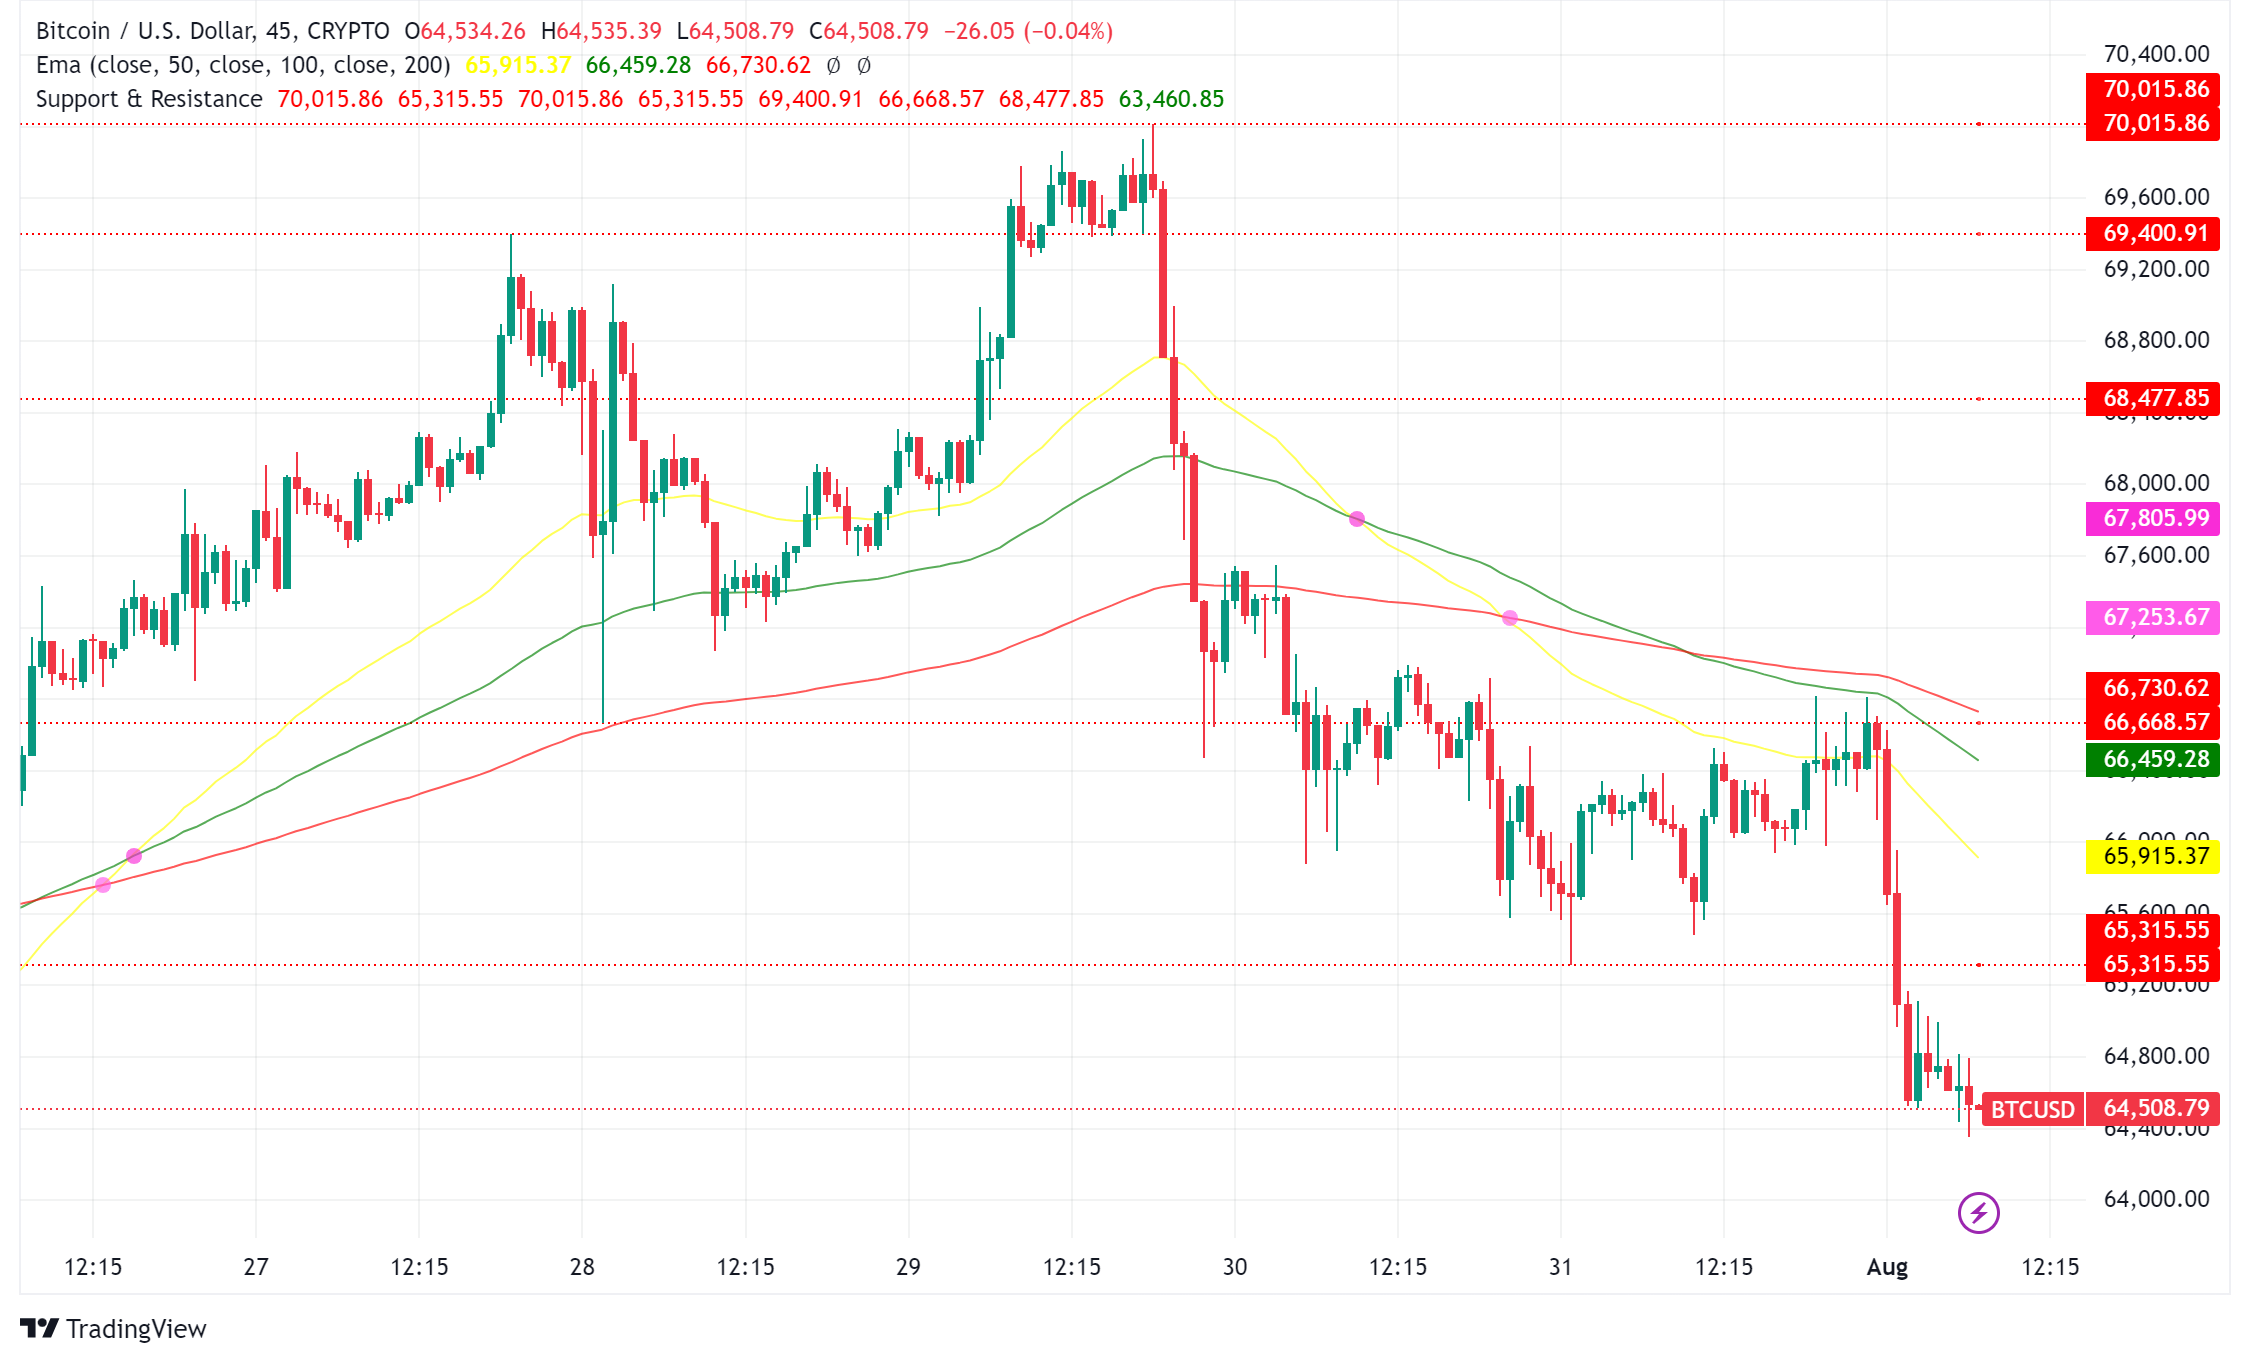
Bitcoin (BTC) has been trading sideways between $65,300 and $68,400 for nearly ten days, with the all-time high of around $69,000 proving to be a stubborn resistance level.
Data from Cointelegraph Markets Pro and TradingView indicates that Bitcoin is currently trading at $66,678, with a slight increase of 0.36% and lower trading volumes, suggesting an extended period of consolidation.
Why is Bitcoin Price Stuck?
The cryptocurrency is caught between two significant price levels. While there have been multiple attempts to push the price towards $70,000, each effort has failed to ignite a sustained upward trend. According to independent trader and analyst Skew, Bitcoin is currently “stuck between spot demand and spot supply.”
Analysis of price action reveals a swing high of $70,000 on July 29 and a swing low of $65,280. This price movement has created new spot demand between $65,000 and $62,000, while supply is building up between $70,000 and $72,000.
Data from Coinglass supports Skew’s observations, showing a significant build-up of bid and ask orders on either side of the spot price. This indicates a tug-of-war between bulls and bears.
Further analysis from IntoTheBlock’s IOMAP model reveals robust support around the $60,000 to $66,000 demand zone and a supplier congestion zone between $66,500 and $70,000, acting as a barrier for upward price movement.
Low Volatility and Market Uncertainty
Bitcoin’s historical volatility remains at its lowest levels, indicating a lack of significant price swings. While this suggests potential for a breakout, it also contributes to the current sideways movement.
The cryptocurrency market has experienced increased volatility in recent days, leading to a surge in crypto liquidations, primarily long positions. This coincides with the upcoming Federal Reserve’s monetary policy decision, adding to market uncertainty.
Potential for Future Price Movements
Despite the current sideways trend, there is potential for Bitcoin to break out of the range. If Bitcoin successfully retests its 20-day Simple Moving Average support, it could initiate a new bull rally. However, the Relative Strength Index suggests bearish sentiment.
Ethereum (ETH) is also facing similar challenges, testing its resistance at the 20-day SMA. Positive indicators like the RSI and Chaikin Money Flow suggest potential for a bullish turnaround.
Bitcoin’s Long-Term Potential
Hedge fund manager James Lavish predicts that Bitcoin could soar to $428,000 if it captures 1% of global investment assets. This ambitious price target is based on the idea that Bitcoin will become widely adopted and attract significant liquidity.
Bitcoin’s increasing adoption, fueled by factors like the launch of Spot Bitcoin ETFs and its reputation as “digital gold,” supports the potential for long-term growth. However, realizing these lofty price predictions depends on various factors, including broader market conditions and regulatory developments.
- Check out our free forex signals
- Follow the top economic events on FX Leaders economic calendar
- Trade better, discover more Forex Trading Strategies
- Open a FREE Trading Account
- Read our latest reviews on: Avatrade, Exness, HFM and XM
Related Articles


Sidebar rates
Related Posts
