Apple (AAPL) Stock Significantly Outperforms S&P 500: A Strong Bullish Trend in 2024

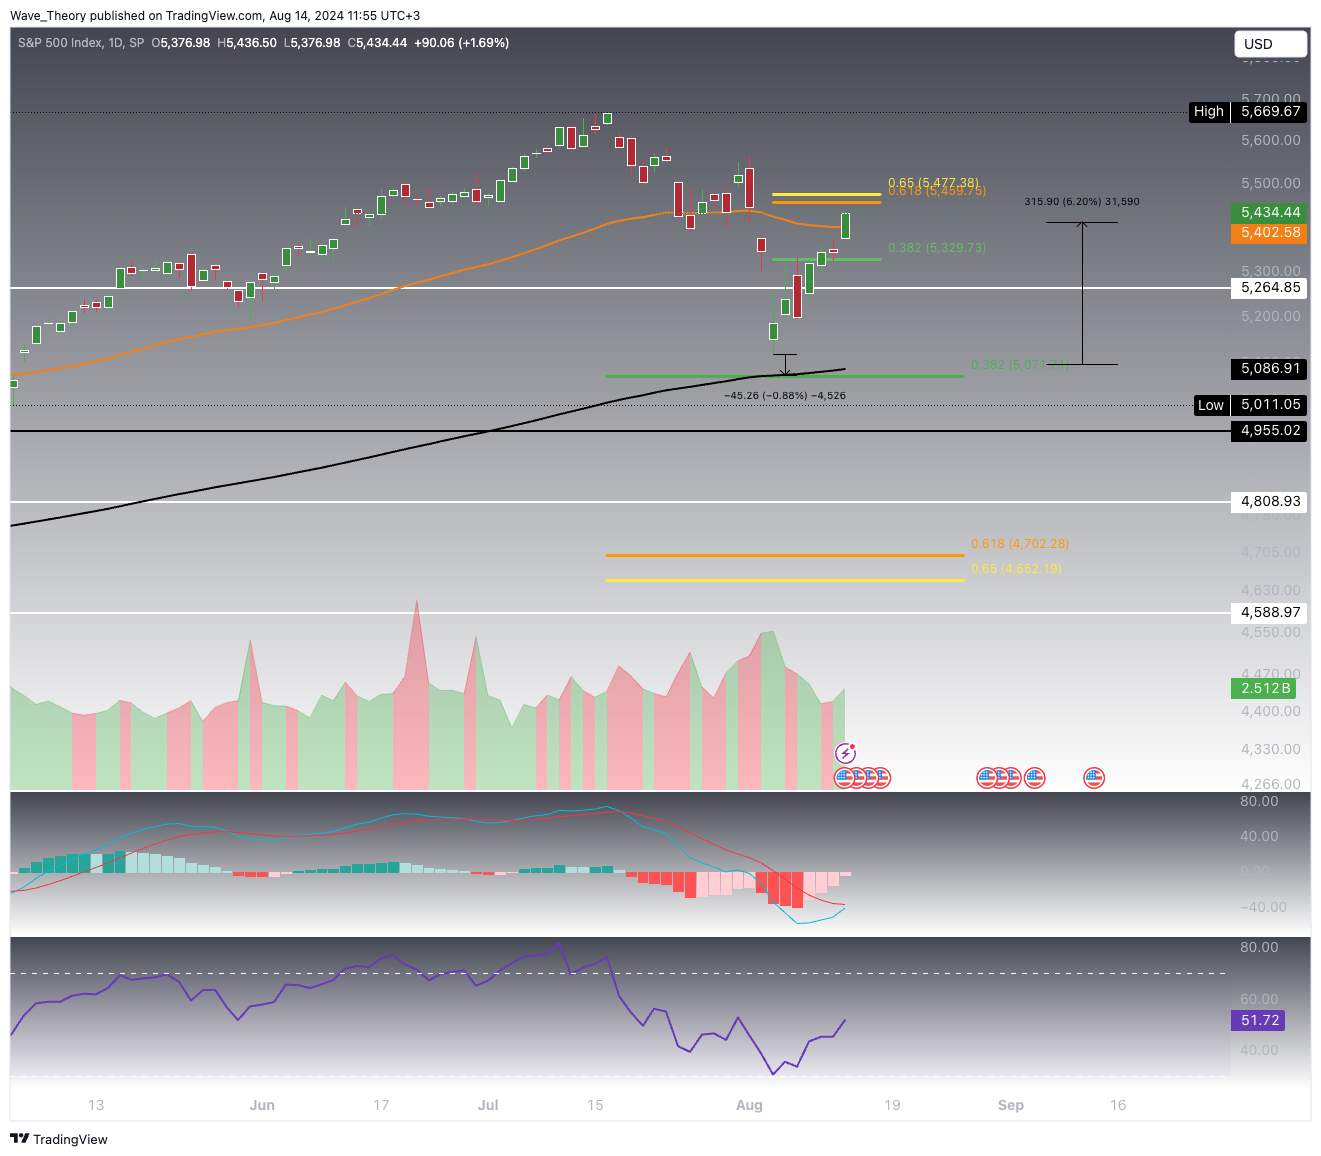
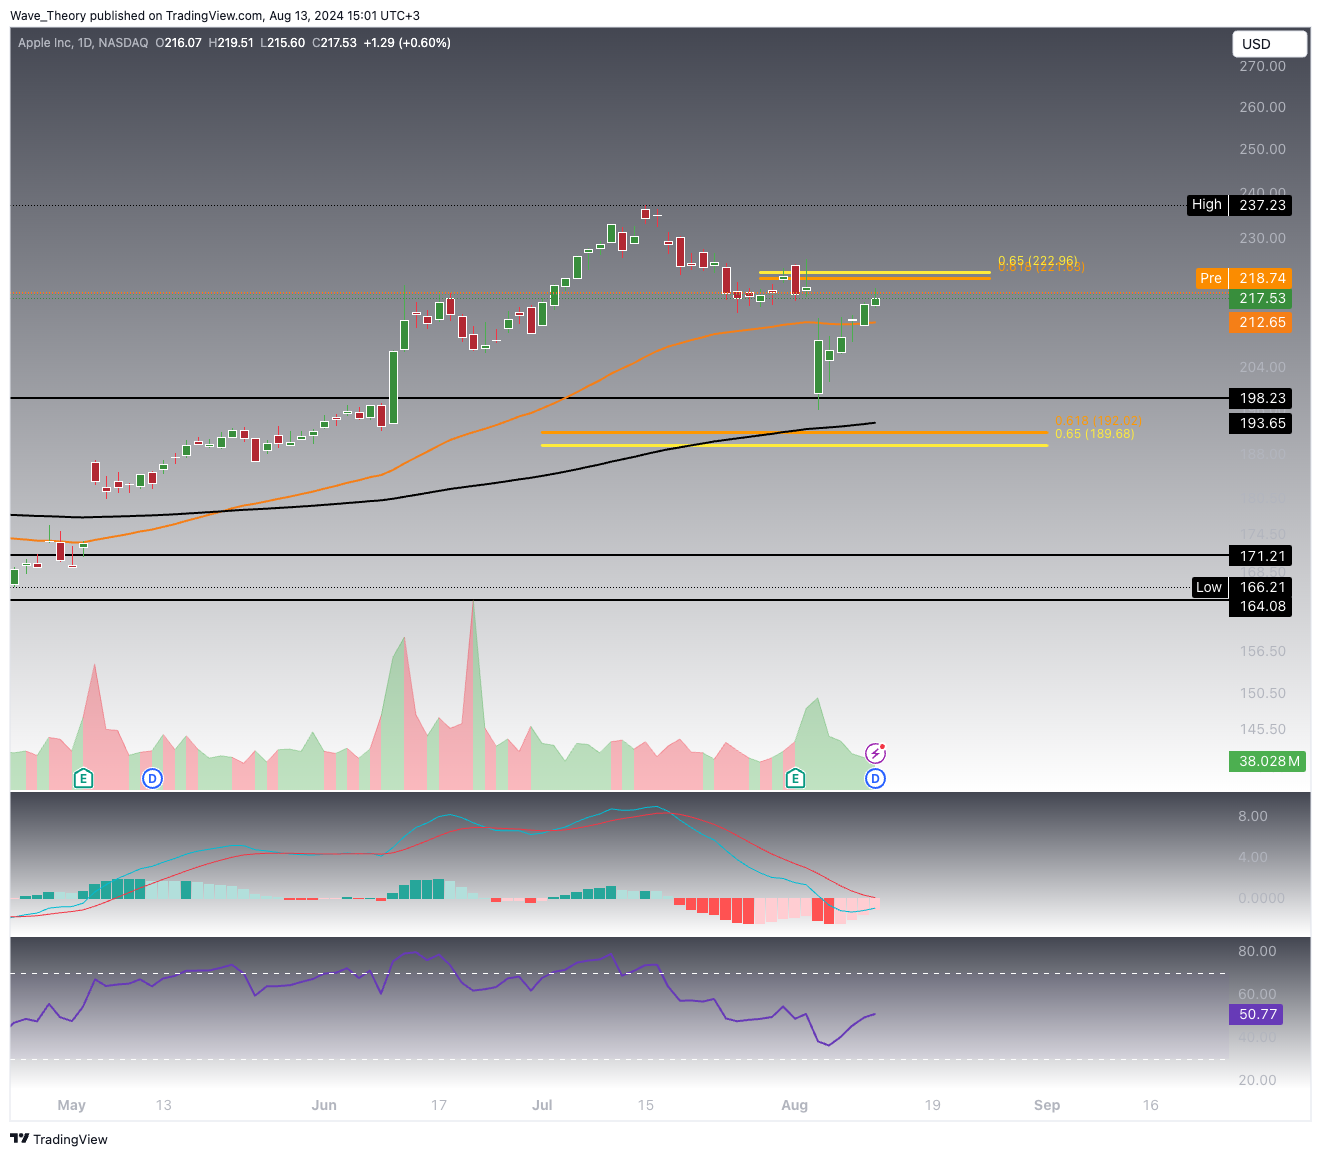
Technical Indicators Signals and Trends (Daily Chart)
- MACD (Moving Average Convergence Divergence): The MACD lines are on the verge of a bullish crossover, supported by a consistently rising histogram over the past four days, indicating increasing bullish momentum.
- RSI (Relative Strength Index): The RSI remains neutral, not signaling any immediate overbought or oversold conditions, which leaves room for further upside.
- EMA (Exponential Moving Average): The recent golden crossover of the EMAs confirms a bullish trend in the short to medium term, reinforcing the positive outlook.
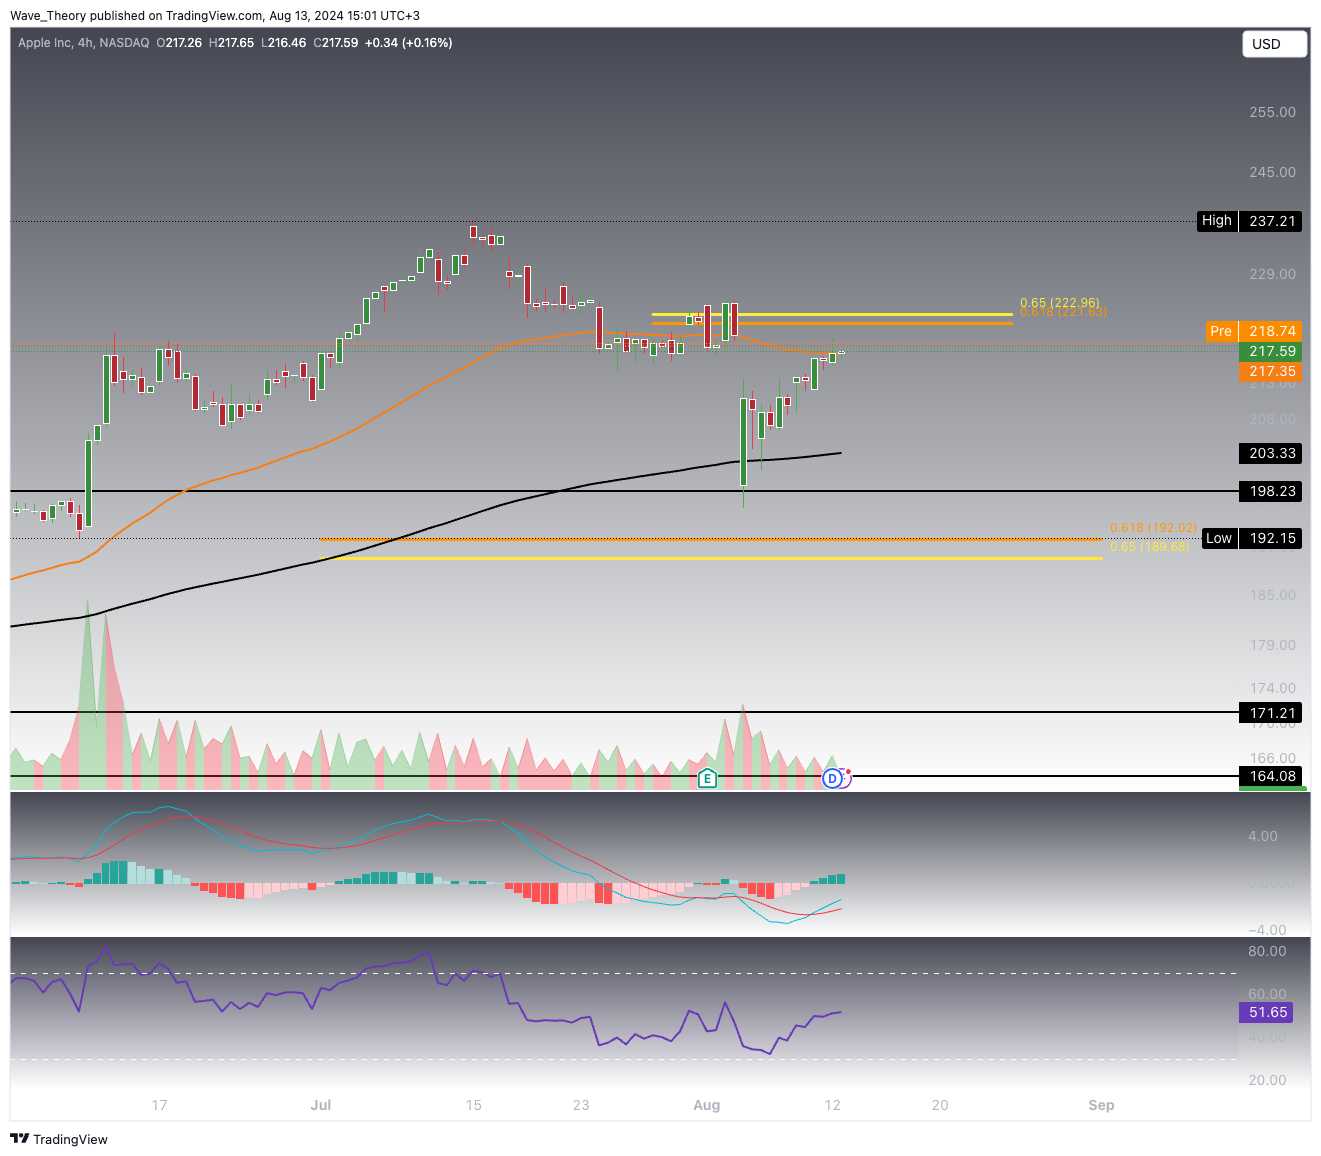
The 4H-Chart Suggests Further Upside
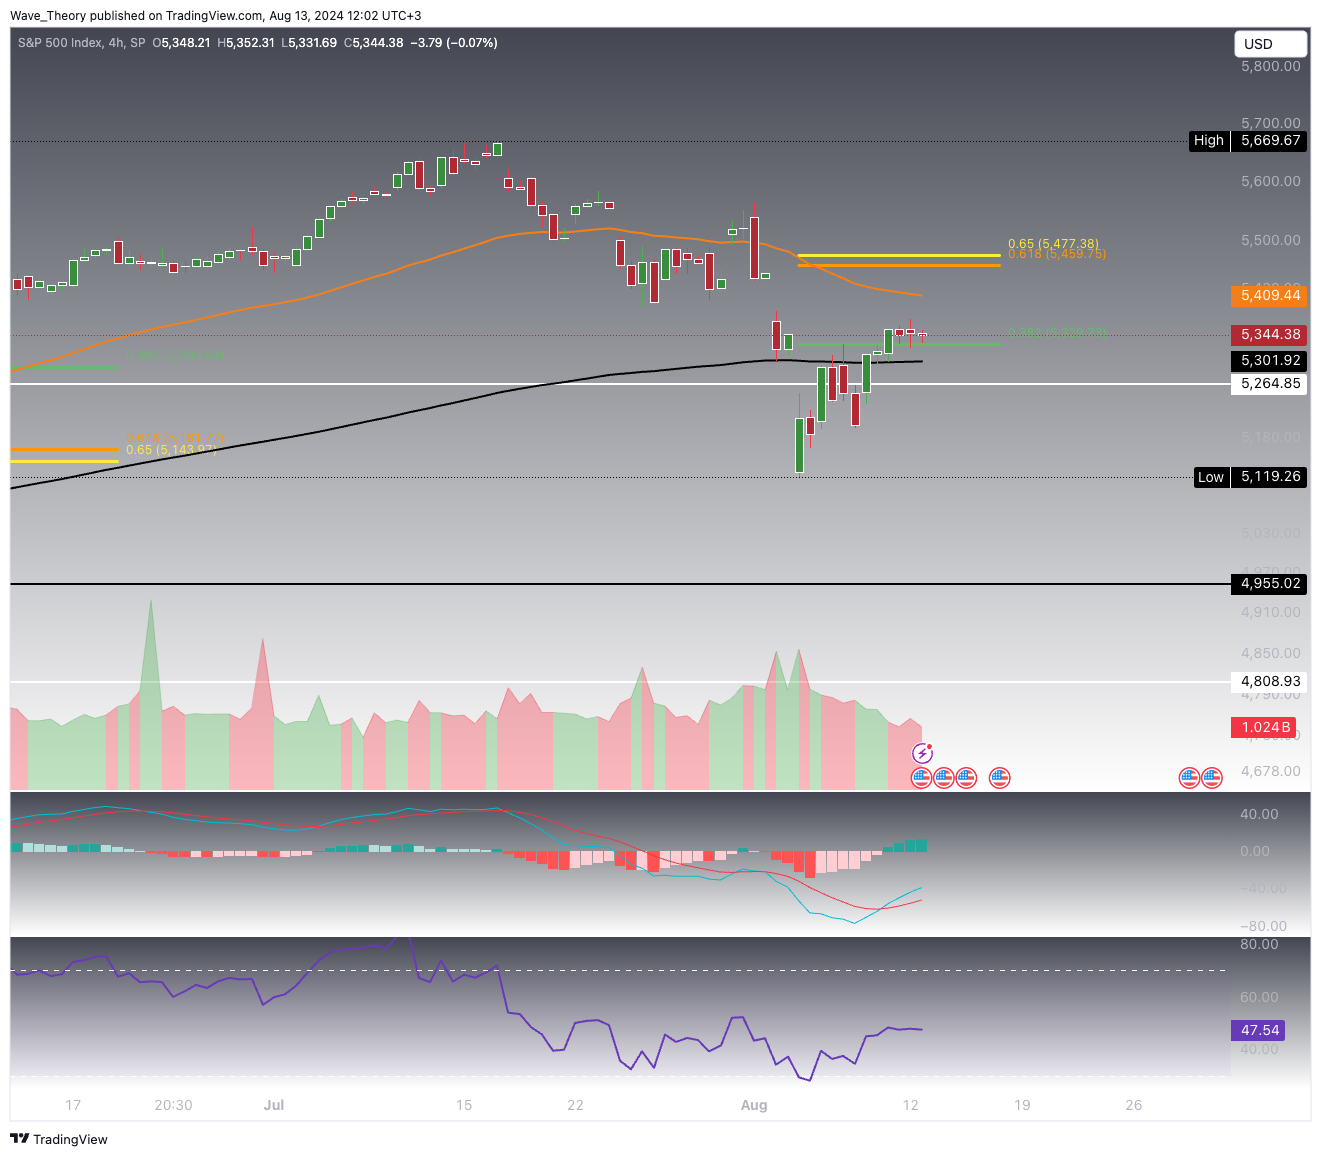
After hitting a new all-time high (ATH) of approximately 5,670 five weeks ago, the S&P 500 (SPX) entered a correction phase. However, with a robust 7% surge in the past week, the SPX appears poised to potentially end the correction and make a move back toward its ATH, possibly even surpassing it. The key to this upward momentum is the SPX’s ability to break the golden ratio resistance at around 5,460. However, the technical indicators present an ambiguous picture on the weekly chart, with mixed signals that make the next move uncertain.
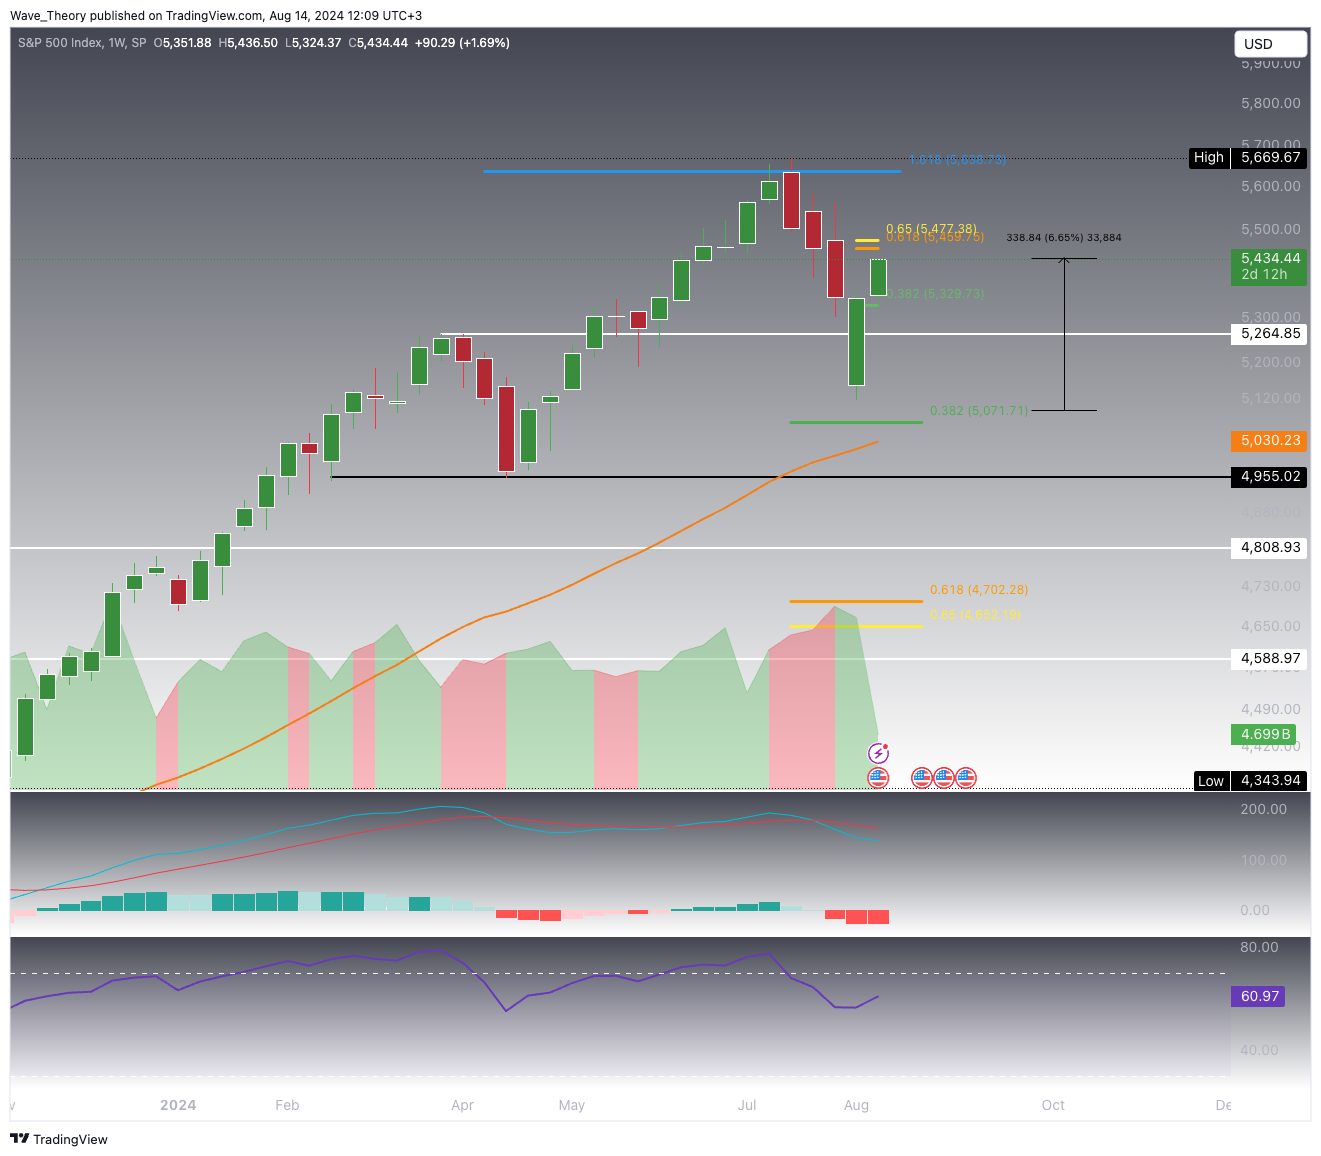
Technical Indicators Signals and Trends (Weekly Chart)
- MACD (Moving Average Convergence Divergence): The MACD lines have crossed bearishly, and the histogram has been trending downward for the past five weeks, indicating ongoing bearish momentum.
- RSI (Relative Strength Index): The RSI remains neutral, not indicating any extreme overbought or oversold conditions, which suggests that there is room for further upside movement.
- EMA (Exponential Moving Average): The golden crossover of the EMAs confirms a bullish trend in the medium term, reinforcing a positive outlook despite recent bearish signals.
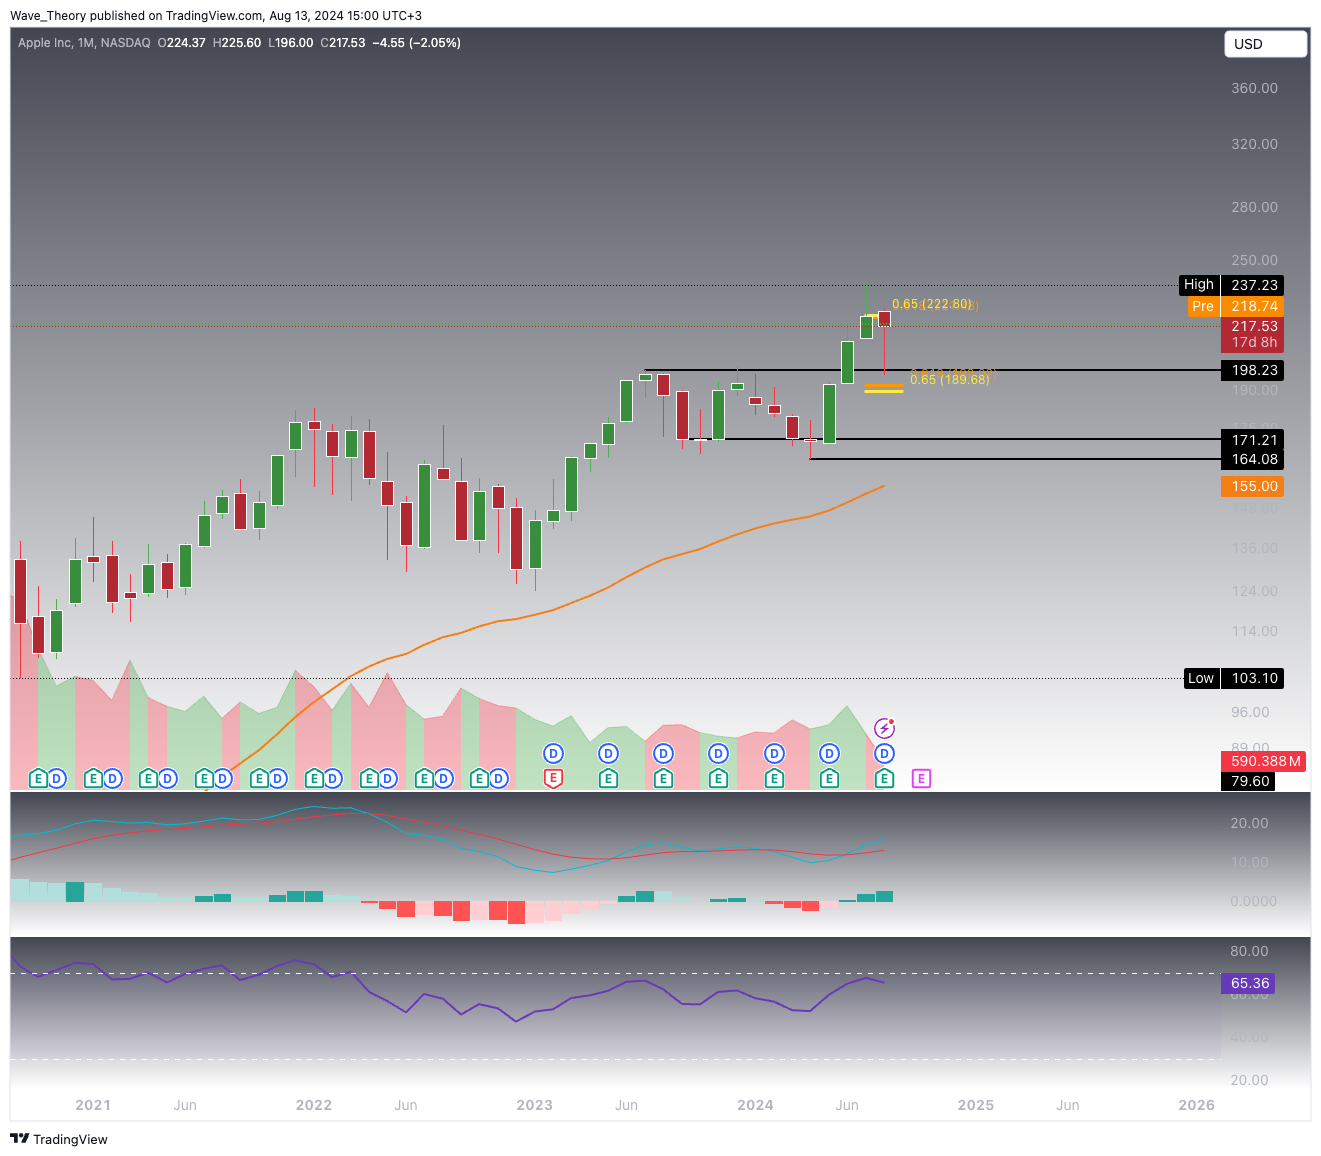
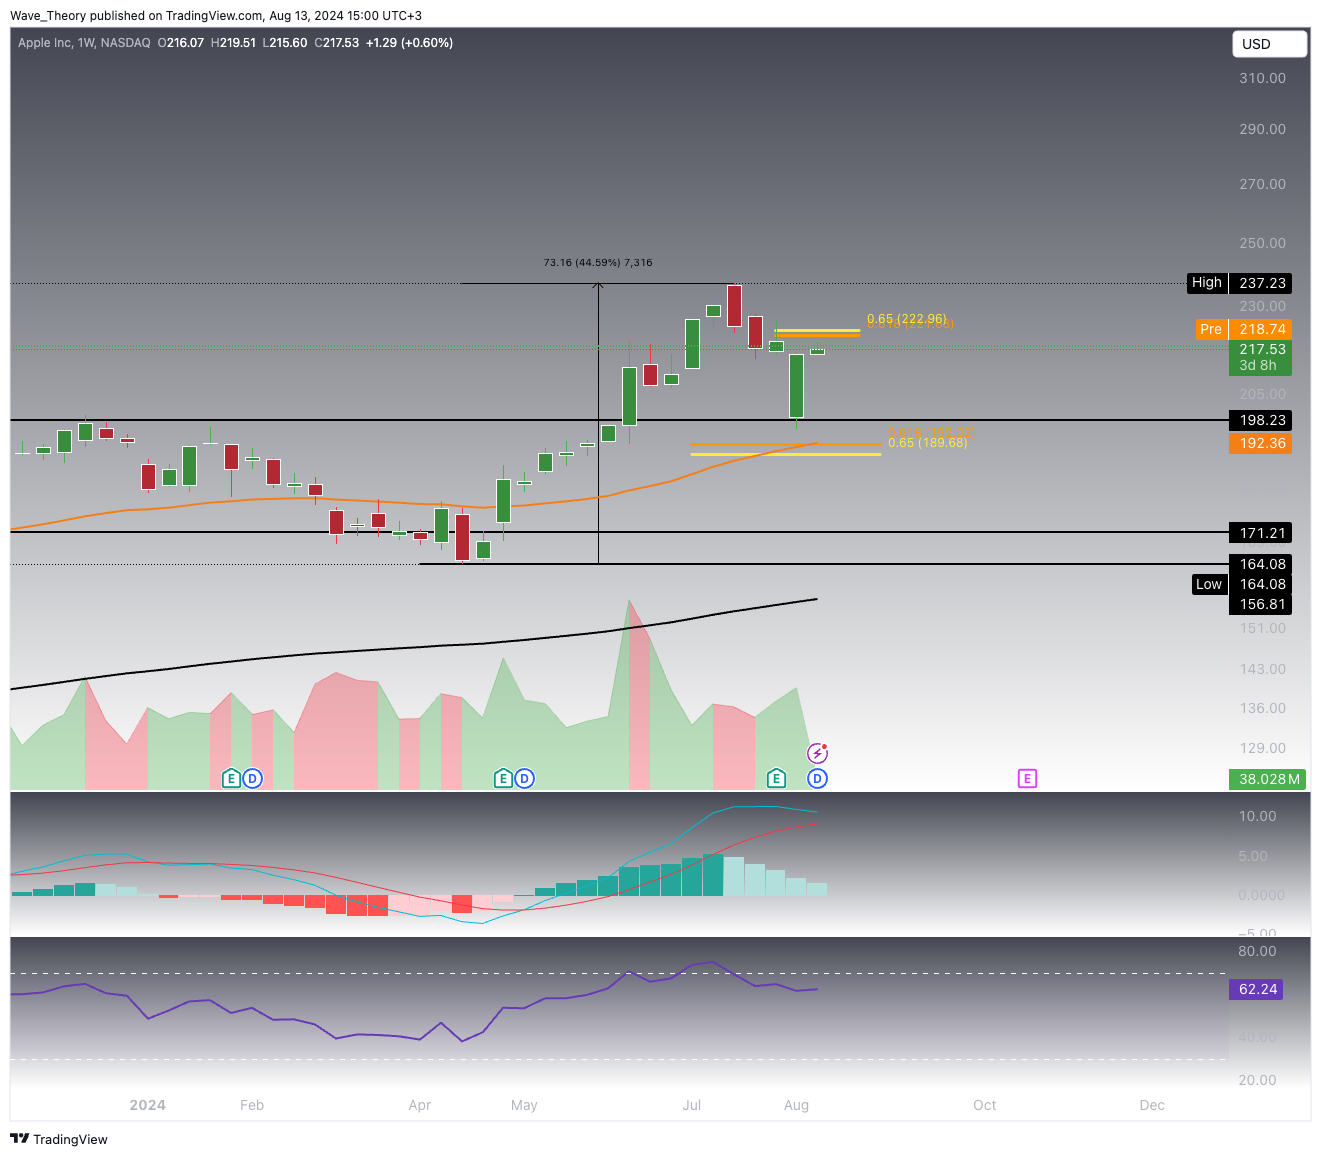
Apple Surges Nearly 45 % After Rebounding from Key Support Zone Between $164 and $171 in April
After bouncing off the support zone between $164 and $171 in April, Apple stock embarked on an impressive upward phase, reaching a new all-time high (ATH) of approximately $237 last month. This surge is supported by bullish signals on the monthly chart.
Technical Indicators Signals and Trends (Monthly Chart)
- MACD (Moving Average Convergence Divergence): The MACD lines have crossed bullishly, with the histogram trending upward for the past four months, suggesting strong ongoing bullish momentum.
- RSI (Relative Strength Index): The RSI remains neutral but is approaching overbought territory, indicating that while there is still room for upward movement, caution is advised.
- EMA (Exponential Moving Average): The golden crossover of the EMAs confirms a bullish trend in the long term, reinforcing the positive outlook.
However, it’s important to note that this month has seen a strong pullback in Apple’s stock, which could indicate some consolidation or a potential reversal in the short term.
After bouncing off the support at $198, Apple stock avoided testing the golden ratio support at the 50-week EMA, which stands at $192. The stock now faces critical Fibonacci resistance at $223. A successful bullish break above this level could signal a return to its uptrend, potentially pushing the stock back toward its previous all-time high (ATH) of $237.
Technical Indicators Signals and Trends (Weekly Chart)
- MACD (Moving Average Convergence Divergence): The MACD remains bullishly crossed, but a potential bearish crossover looms as the histogram has been trending downward for the past five weeks, suggesting weakening momentum.
- RSI (Relative Strength Index): The RSI is neutral, having recently exited overbought territory, which could indicate room for further consolidation or a potential reversal.
- EMA (Exponential Moving Average): The golden crossover of the EMAs confirms a bullish trend in the mid-term, supporting a generally positive outlook despite the recent pullback.
Apple’s ability to break above the $223 resistance will be crucial in determining whether it can resume its upward trajectory and challenge its previous ATH.
After breaking above the 50-day EMA resistance at $212.65, Apple now faces a critical test at the Golden Ratio resistance at $223. If rejected at this level, Apple’s next major support lies back at the 50-day EMA at $212.65, with additional support at $198 and $192.
Technical Indicators Signals and Trends (Daily Chart)
- MACD (Moving Average Convergence Divergence): The MACD is currently bearishly crossed, but with the histogram trending upward for the past four days, a potential bullish crossover could signal a shift in momentum.
- RSI (Relative Strength Index): The RSI remains neutral, offering no strong directional bias.
- EMA (Exponential Moving Average): The golden crossover of the EMAs confirms a bullish trend in the short-to-mid term, suggesting a generally positive outlook despite recent pullbacks.
Apple is on the verge of breaking the 50-4H EMA resistance at $217.35, potentially setting up a surge toward the golden ratio resistance at $223.
Technical Indicators Signals and Trends (4H Chart)
- MACD (Moving Average Convergence Divergence): The MACD lines have crossed bullishly, with the histogram ticking higher, indicating increasing bullish momentum.
- RSI (Relative Strength Index): The RSI remains neutral, offering no clear directional bias.
- EMA (Exponential Moving Average): The golden crossover of the EMAs confirms a bullish trend in the short term, supporting the potential for further gains.
- Check out our free forex signals
- Follow the top economic events on FX Leaders economic calendar
- Trade better, discover more Forex Trading Strategies
- Open a FREE Trading Account
- Read our latest reviews on: Avatrade, Exness, HFM and XM
Related Articles


Sidebar rates
Related Posts
