Intel Corporation (INTC) Stock Faces Significant Losses, But Is a Rebound Possible?
•
Last updated: Sunday, December 8, 2024

With competitors like Nvidia experiencing massive bull runs, Intel (INTC) has suffered a steep decline this year. Is there hope for a recovery?
Intel Stock Declined by 63.2% This Year
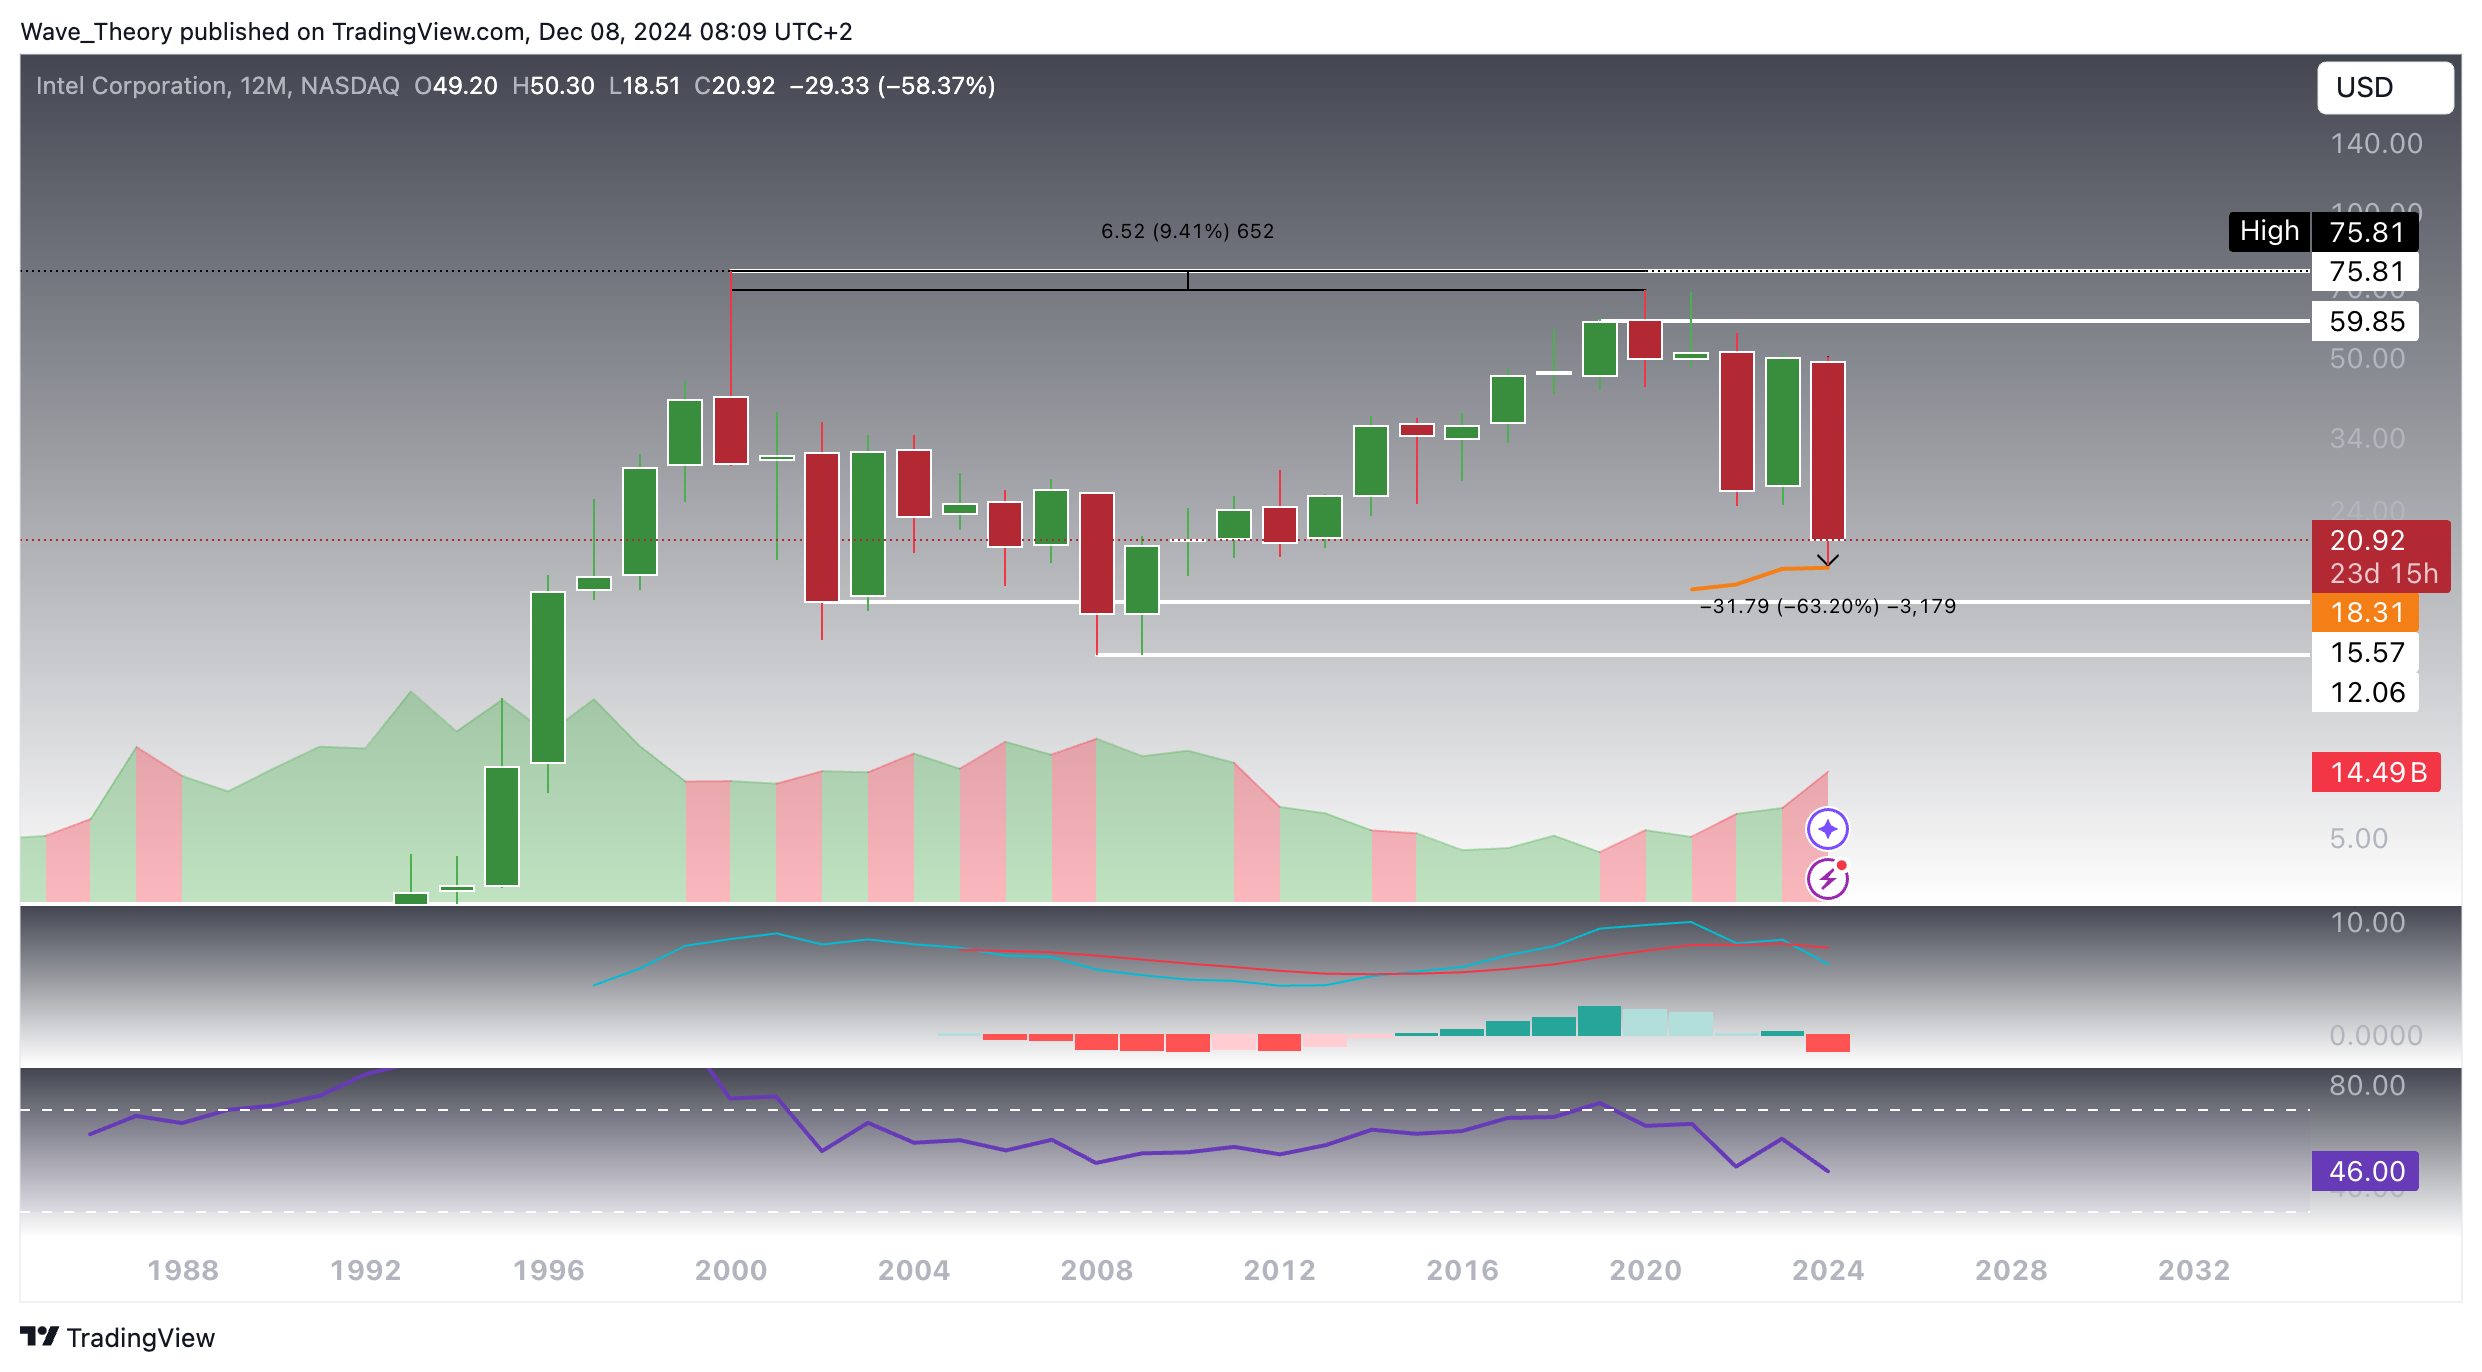
As we approach the end of the year, Intel has seen its stock plummet by 63.2%. Despite a strong uptrend from 2008 to 2020, it remains 9.4% below its all-time high of $75.81, set in 2000. This means Intel has been in a long-term downtrend for over two decades.
The technical indicators paint a bearish picture:
- MACD: The MACD lines crossed bearishly earlier this year, and the histogram has been ticking lower, indicating continued downward pressure.
- RSI: The RSI remains in neutral territory, offering no clear signals regarding an imminent reversal or continued decline.
However, the 50-year EMA at $18.31 now acts as major support. This could serve as a potential bounce point for the stock, giving Intel a chance to reverse its current trend if it holds above this critical level.
While the technical outlook remains bearish, Intel’s long history and current support levels suggest there may still be hope for a rebound. Traders should closely monitor how the stock behaves around this support zone.
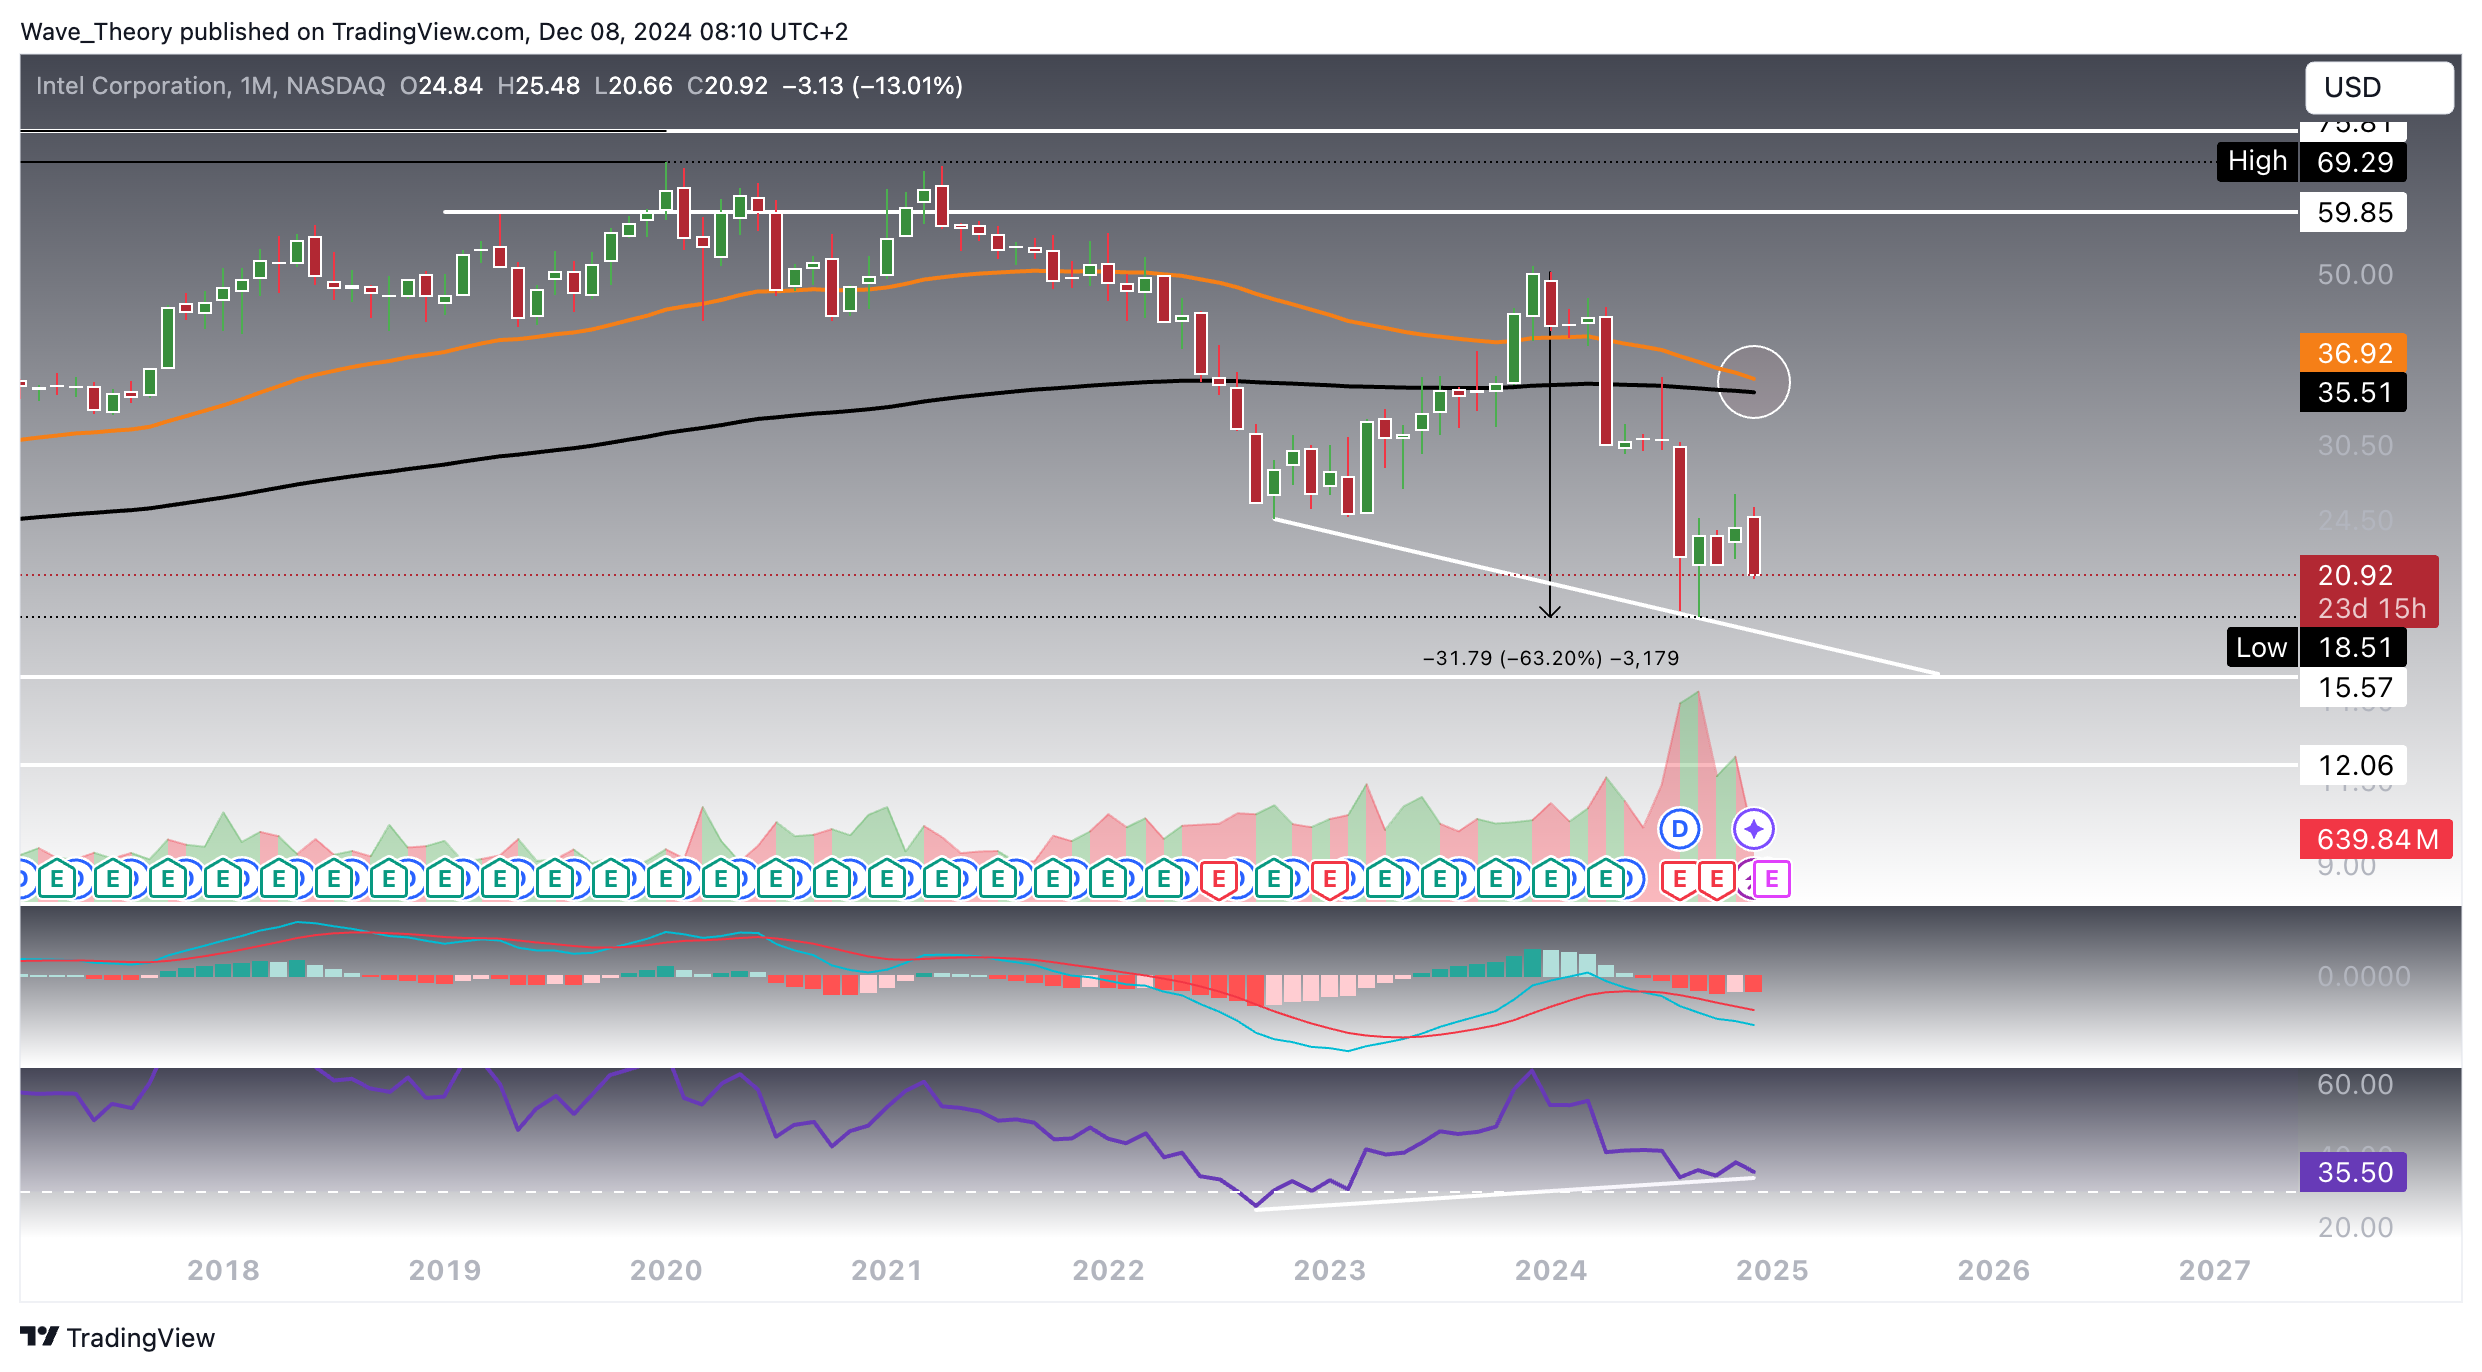
On the monthly chart, Intel (INTC) faces the potential of a death cross, where the shorter-term EMA could cross below the longer-term EMA, signaling a bearish trend in the mid to long term. This development would reinforce the already negative outlook, with the MACD lines crossed bearishly and the histogram ticking lower.
However, the RSI presents a contrasting signal, as it extends a bullish divergence, hinting at a possible strong bounce ahead. Intel is also approaching a critical support zone between $12 and $15.6, which could act as a foundation for a rebound.
While the death cross looms, the RSI’s bullish divergence and major support levels suggest that a strong bounce may still be on the horizon, offering cautious optimism for a reversal.
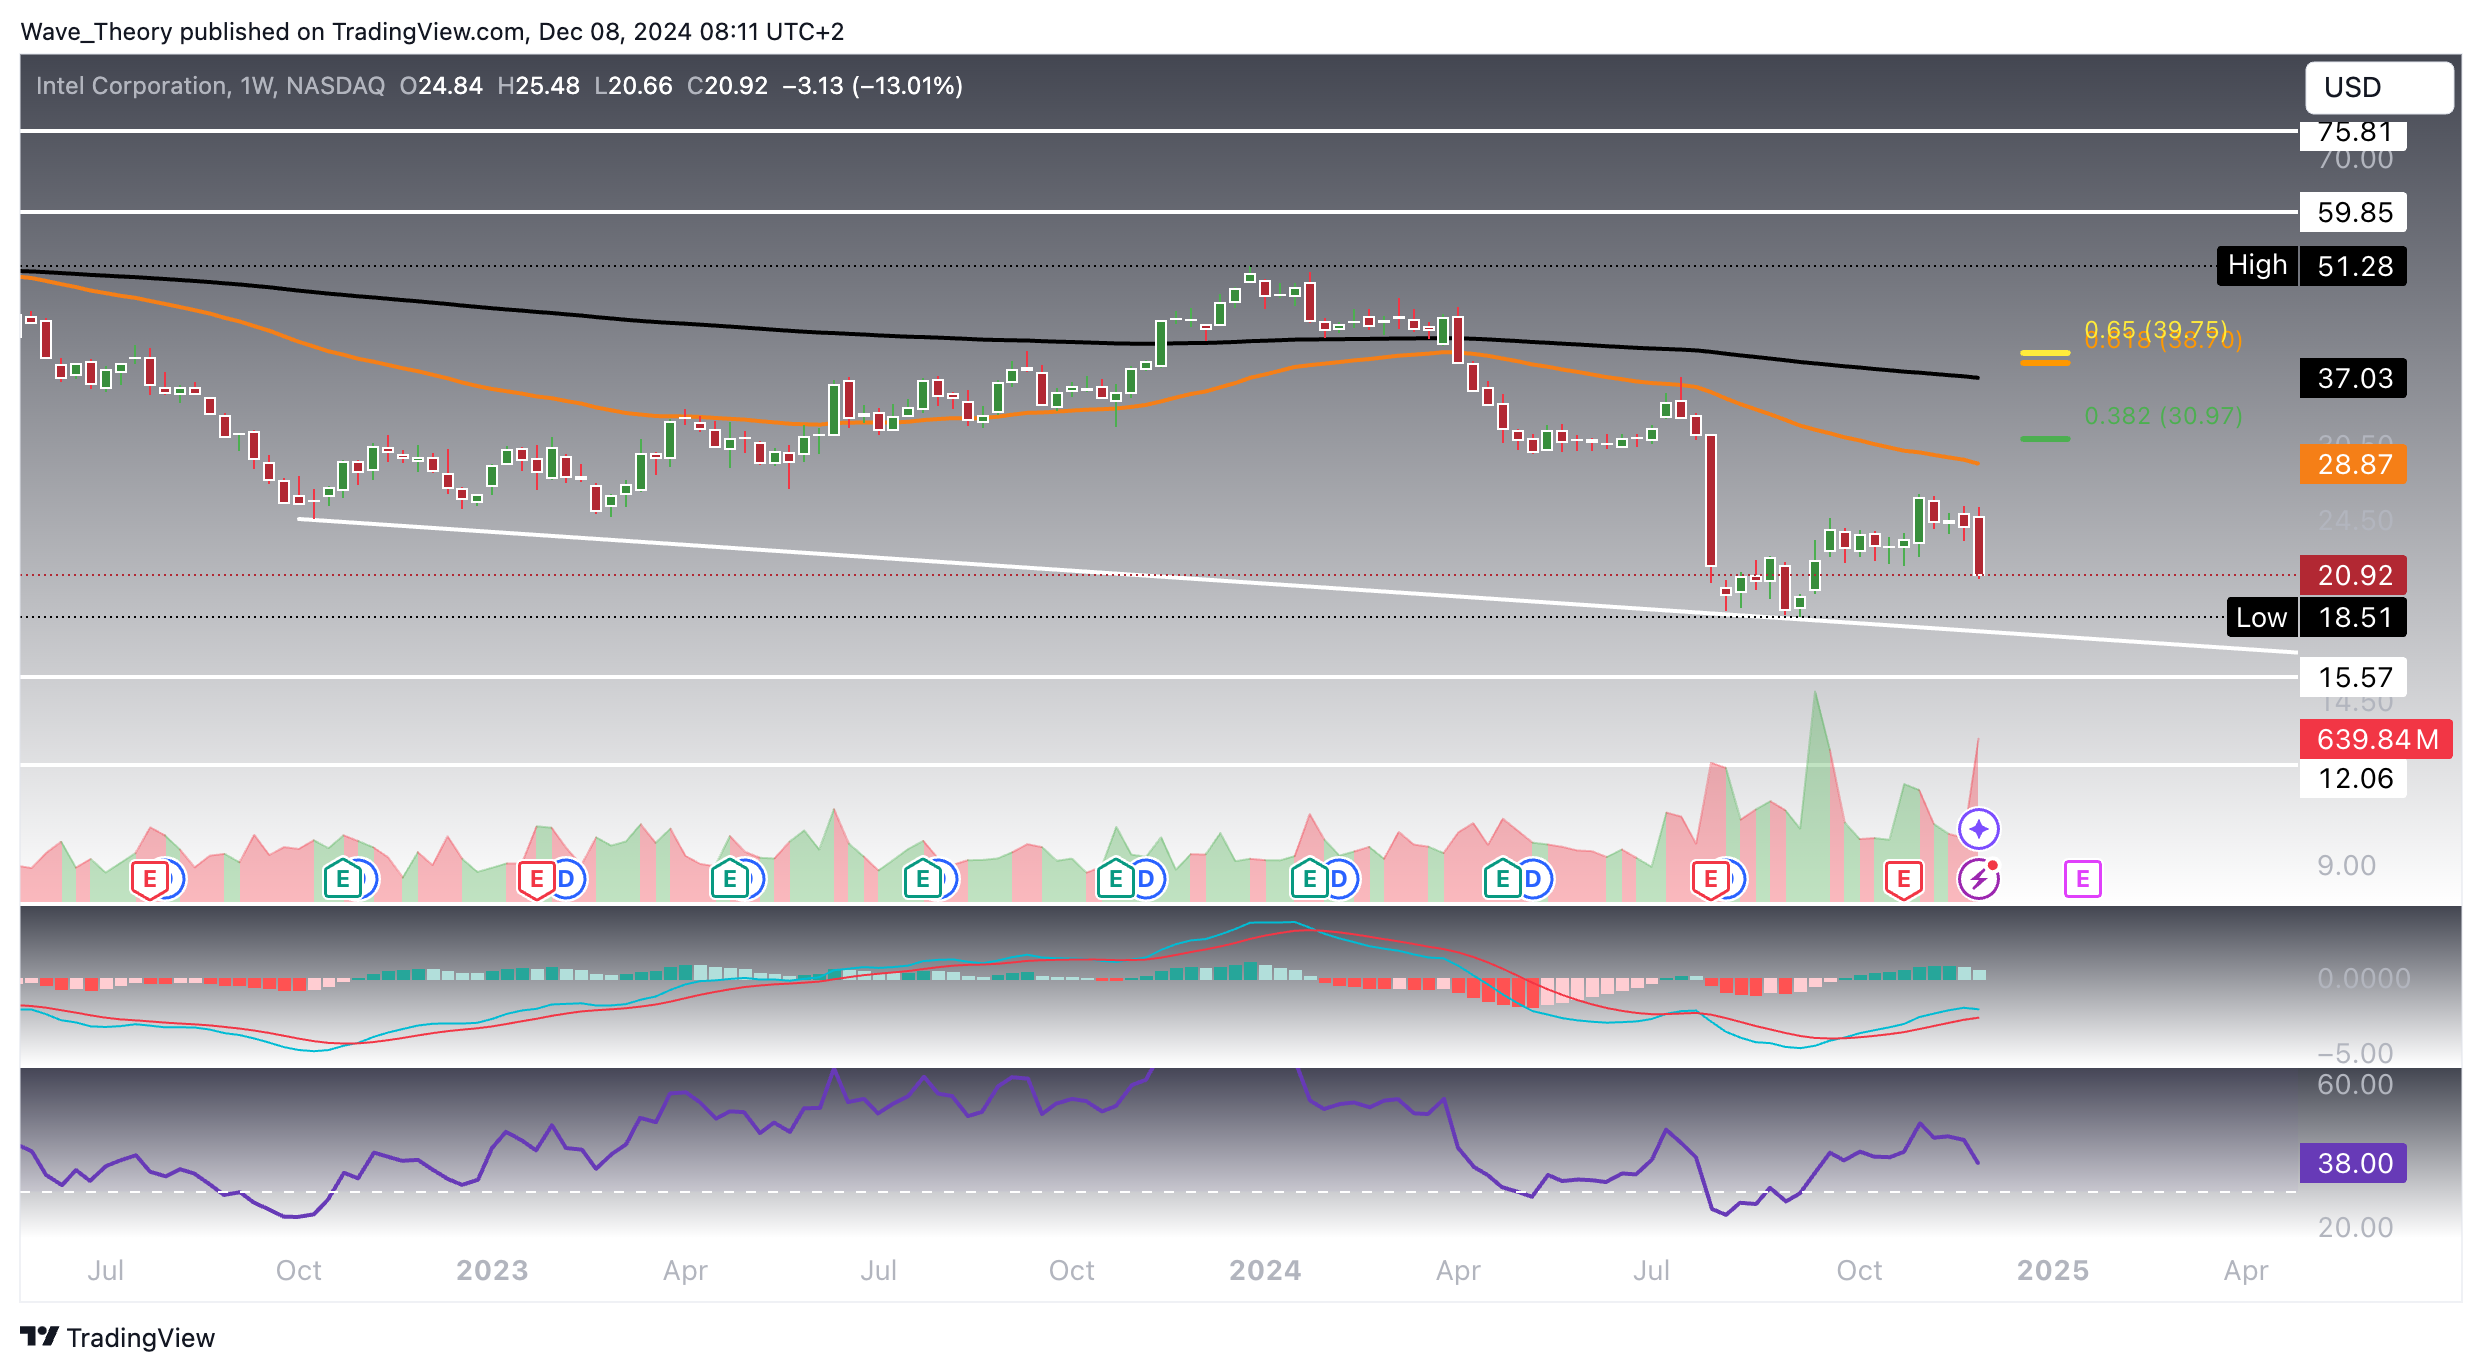
On the weekly chart, Intel has already formed a death cross, signaling a confirmed bearish trend in the mid-term. The MACD histogram has been ticking bearishly lower since last week, reinforcing this downward outlook. However, the MACD lines remain crossed bullishly, suggesting potential for a reversal, while the RSI holds a neutral position.
Should Intel initiate an upward move, its next significant Fibonacci resistance levels lie at $31 and $39.5, which could act as key barriers to further gains.
Daily Chart: Bearish Signals Dominate for INTC

- Check out our free forex signals
- Follow the top economic events on FX Leaders economic calendar
- Trade better, discover more Forex Trading Strategies
- Open a FREE Trading Account
- Read our latest reviews on: Avatrade, Exness, HFM and XM
ABOUT THE AUTHOR
See More
Konstantin Kaiser
Financial Writer and Market Analyst
Konstantin Kaiser comes from a data science background and has significant experience in quantitative trading. His interest in technology took a notable turn in 2013 when he discovered Bitcoin and was instantly intrigued by the potential of this disruptive technology.
Related Articles

Sidebar rates
Related Posts
