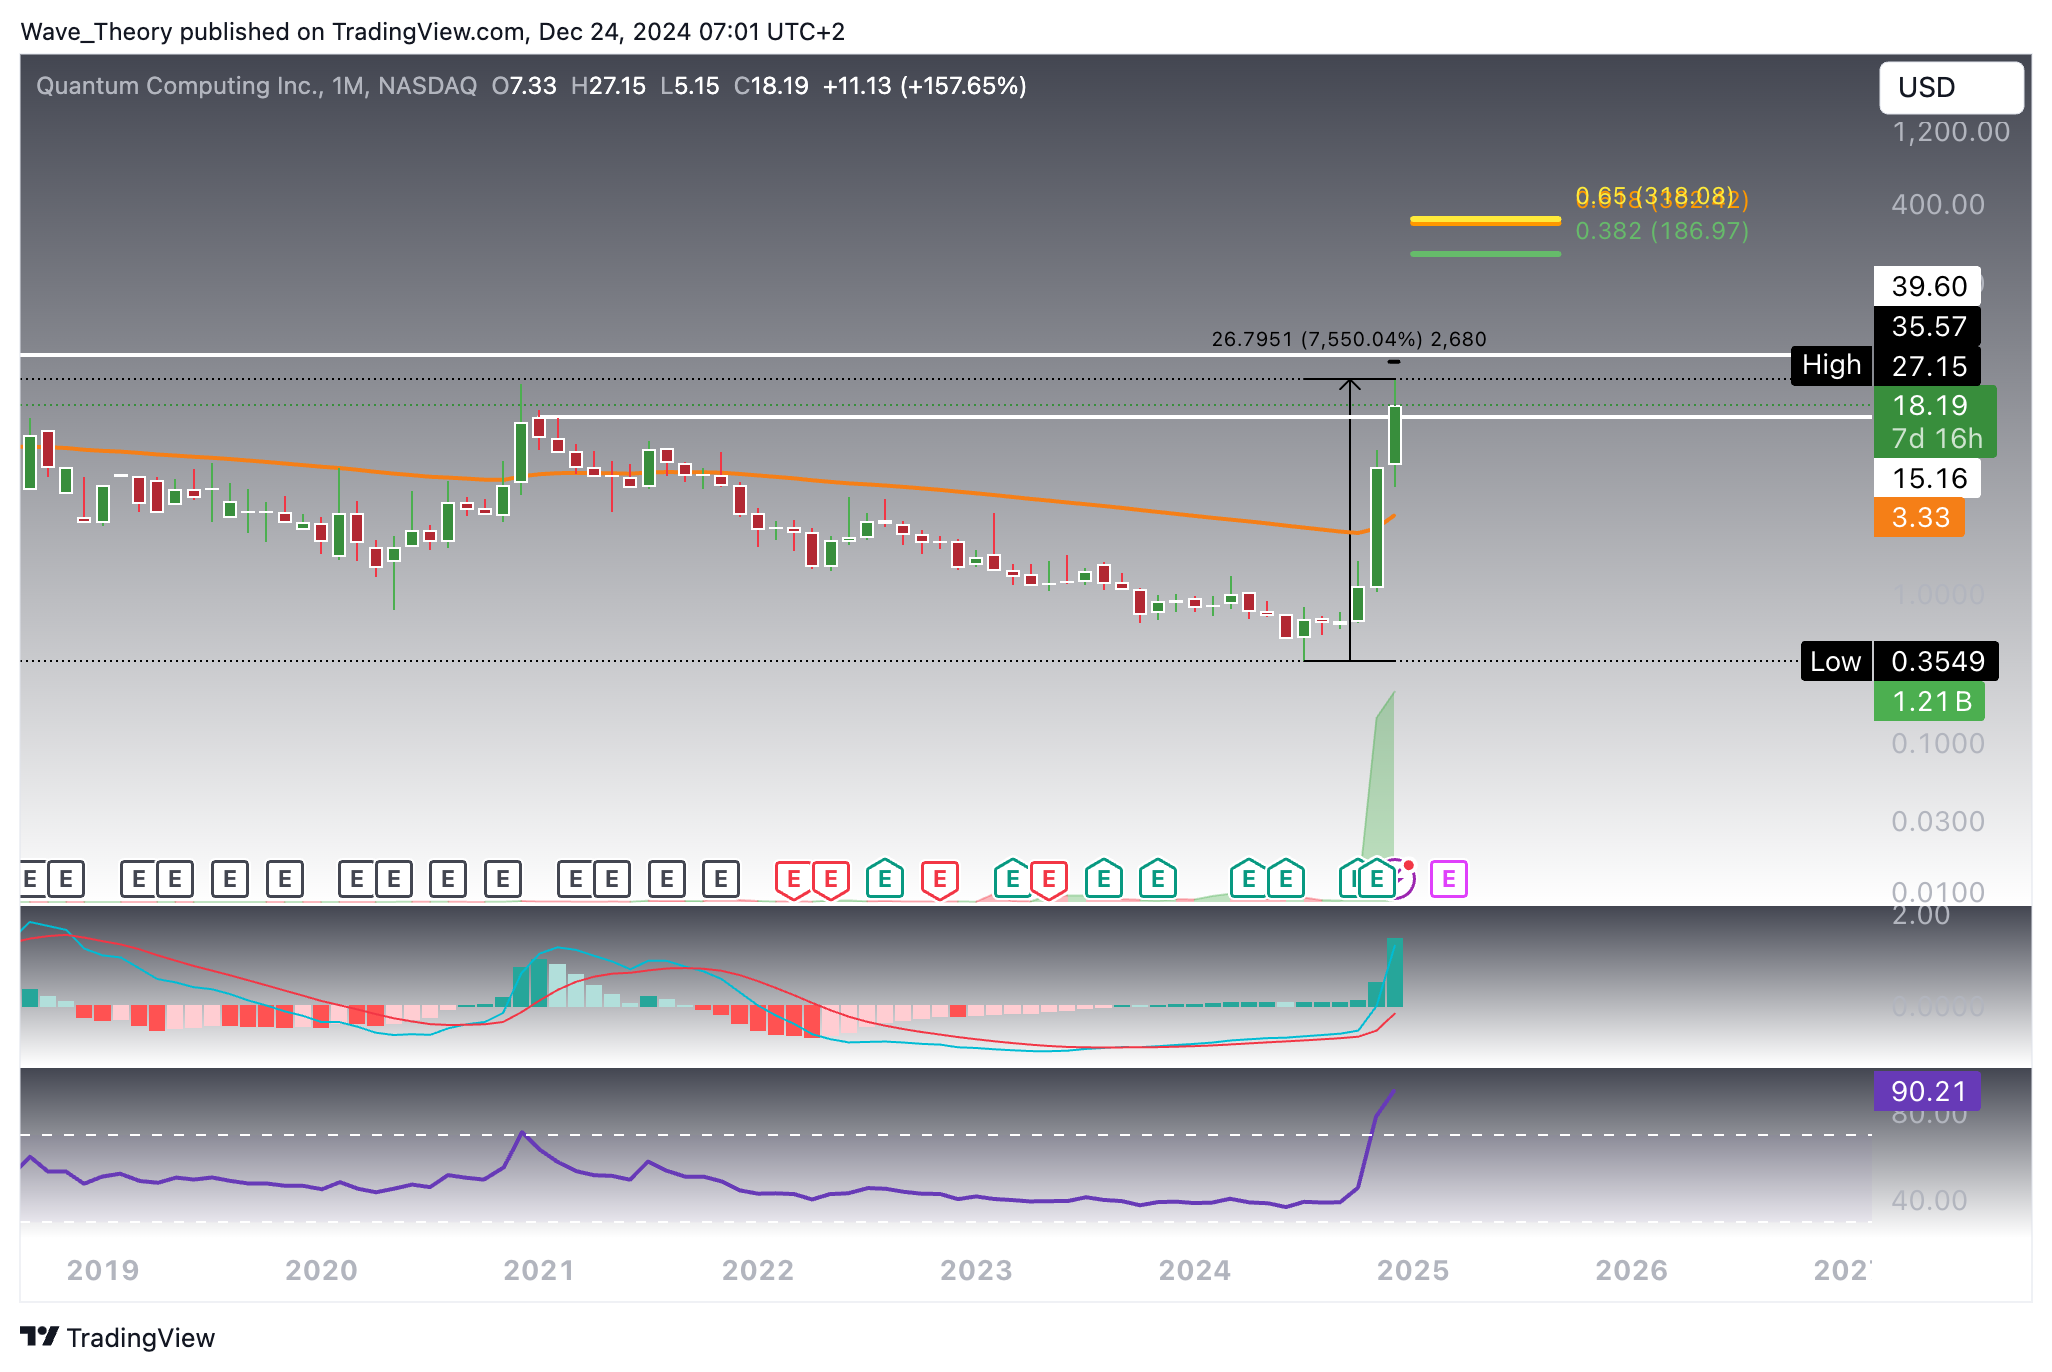
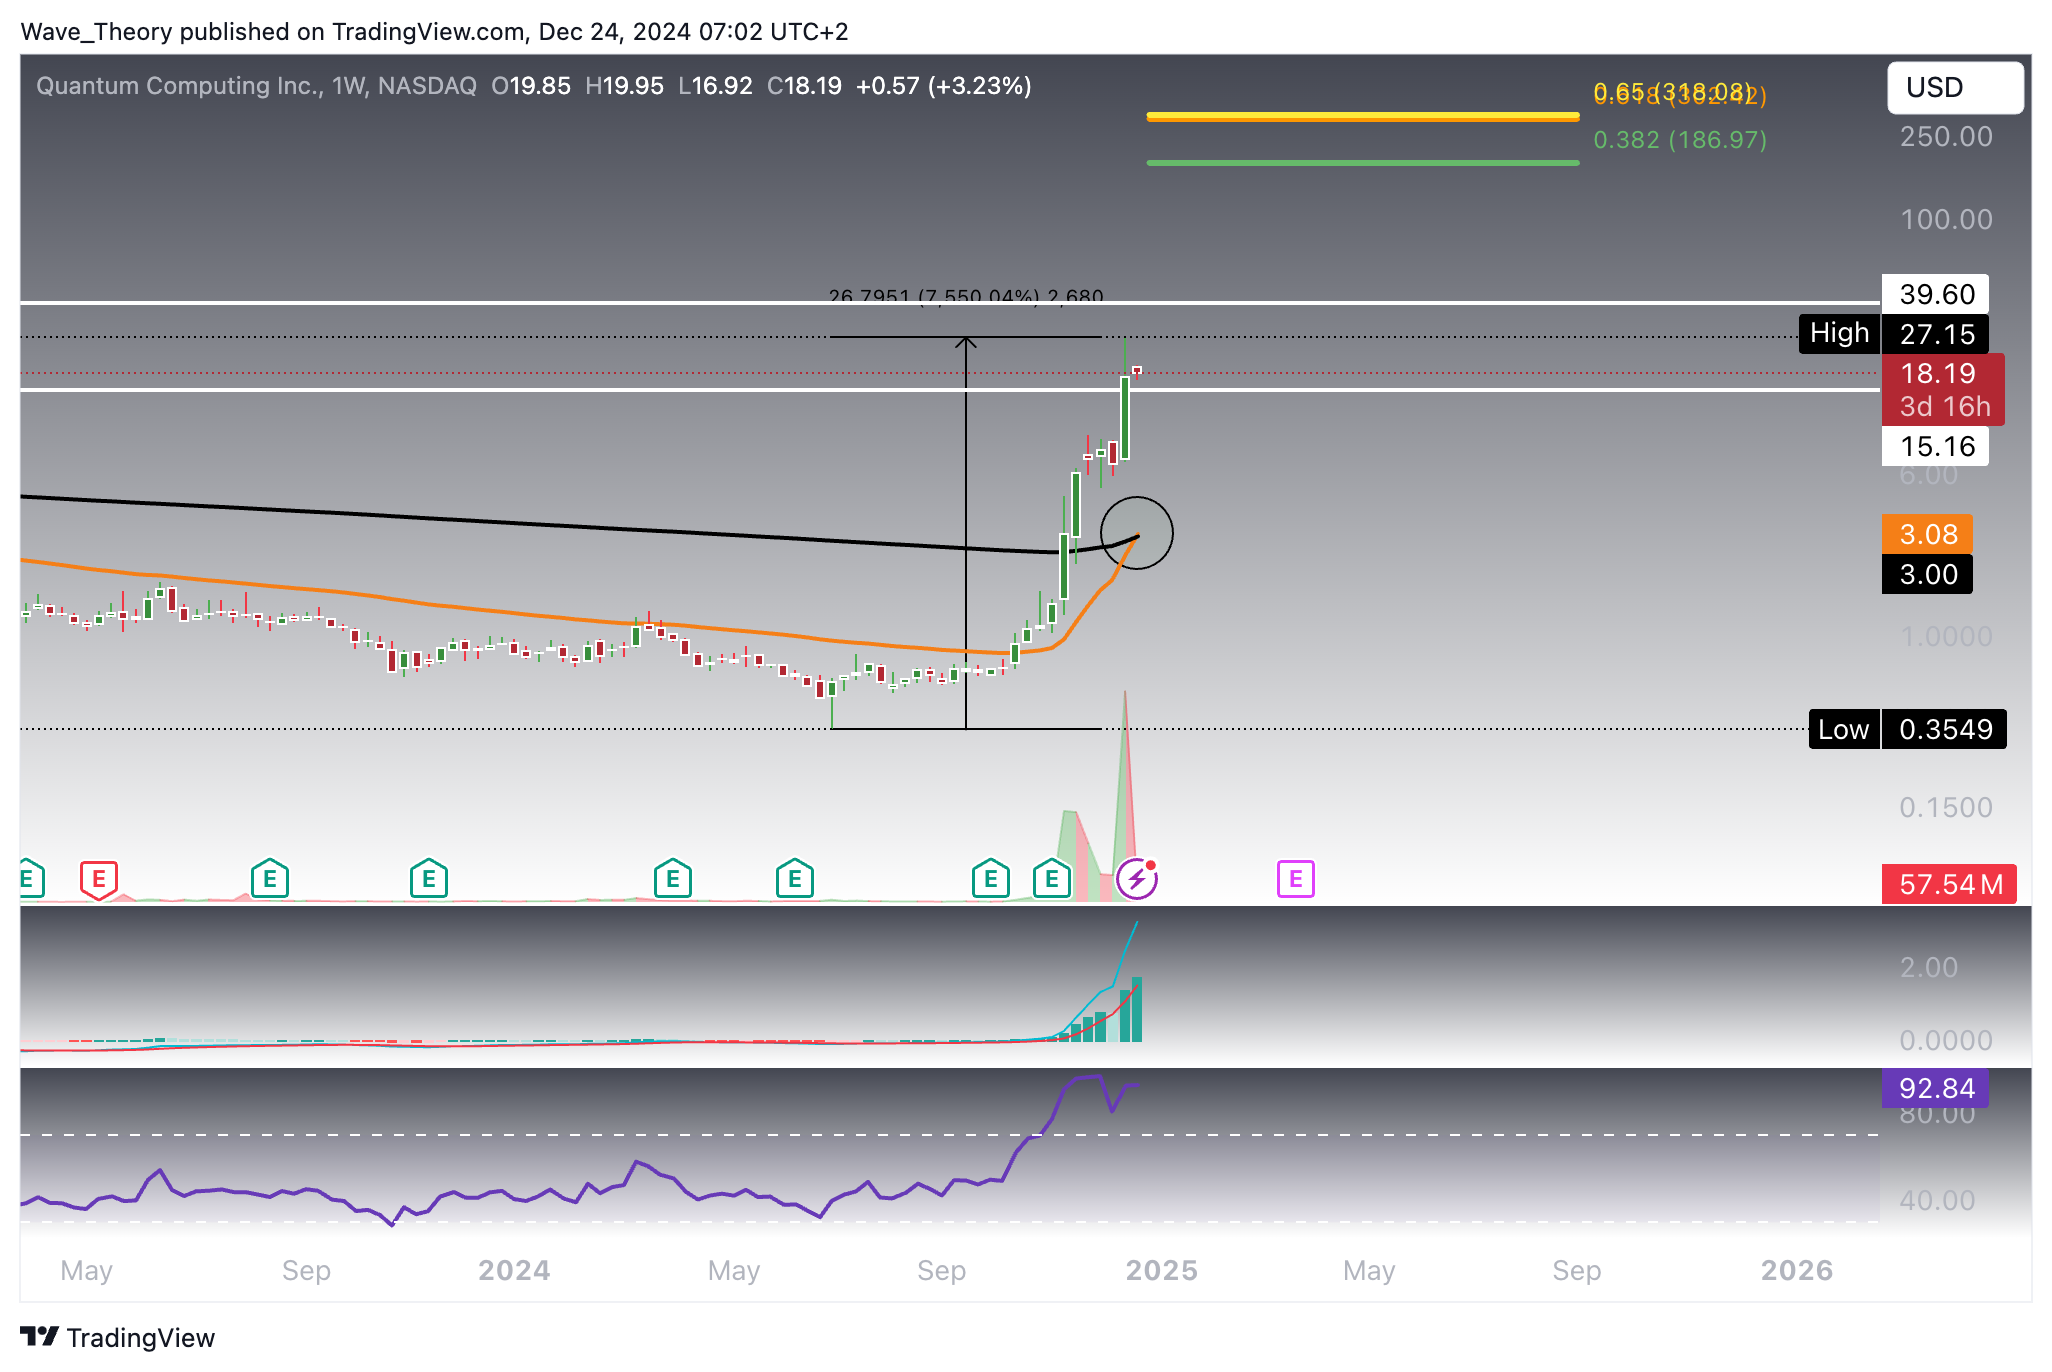
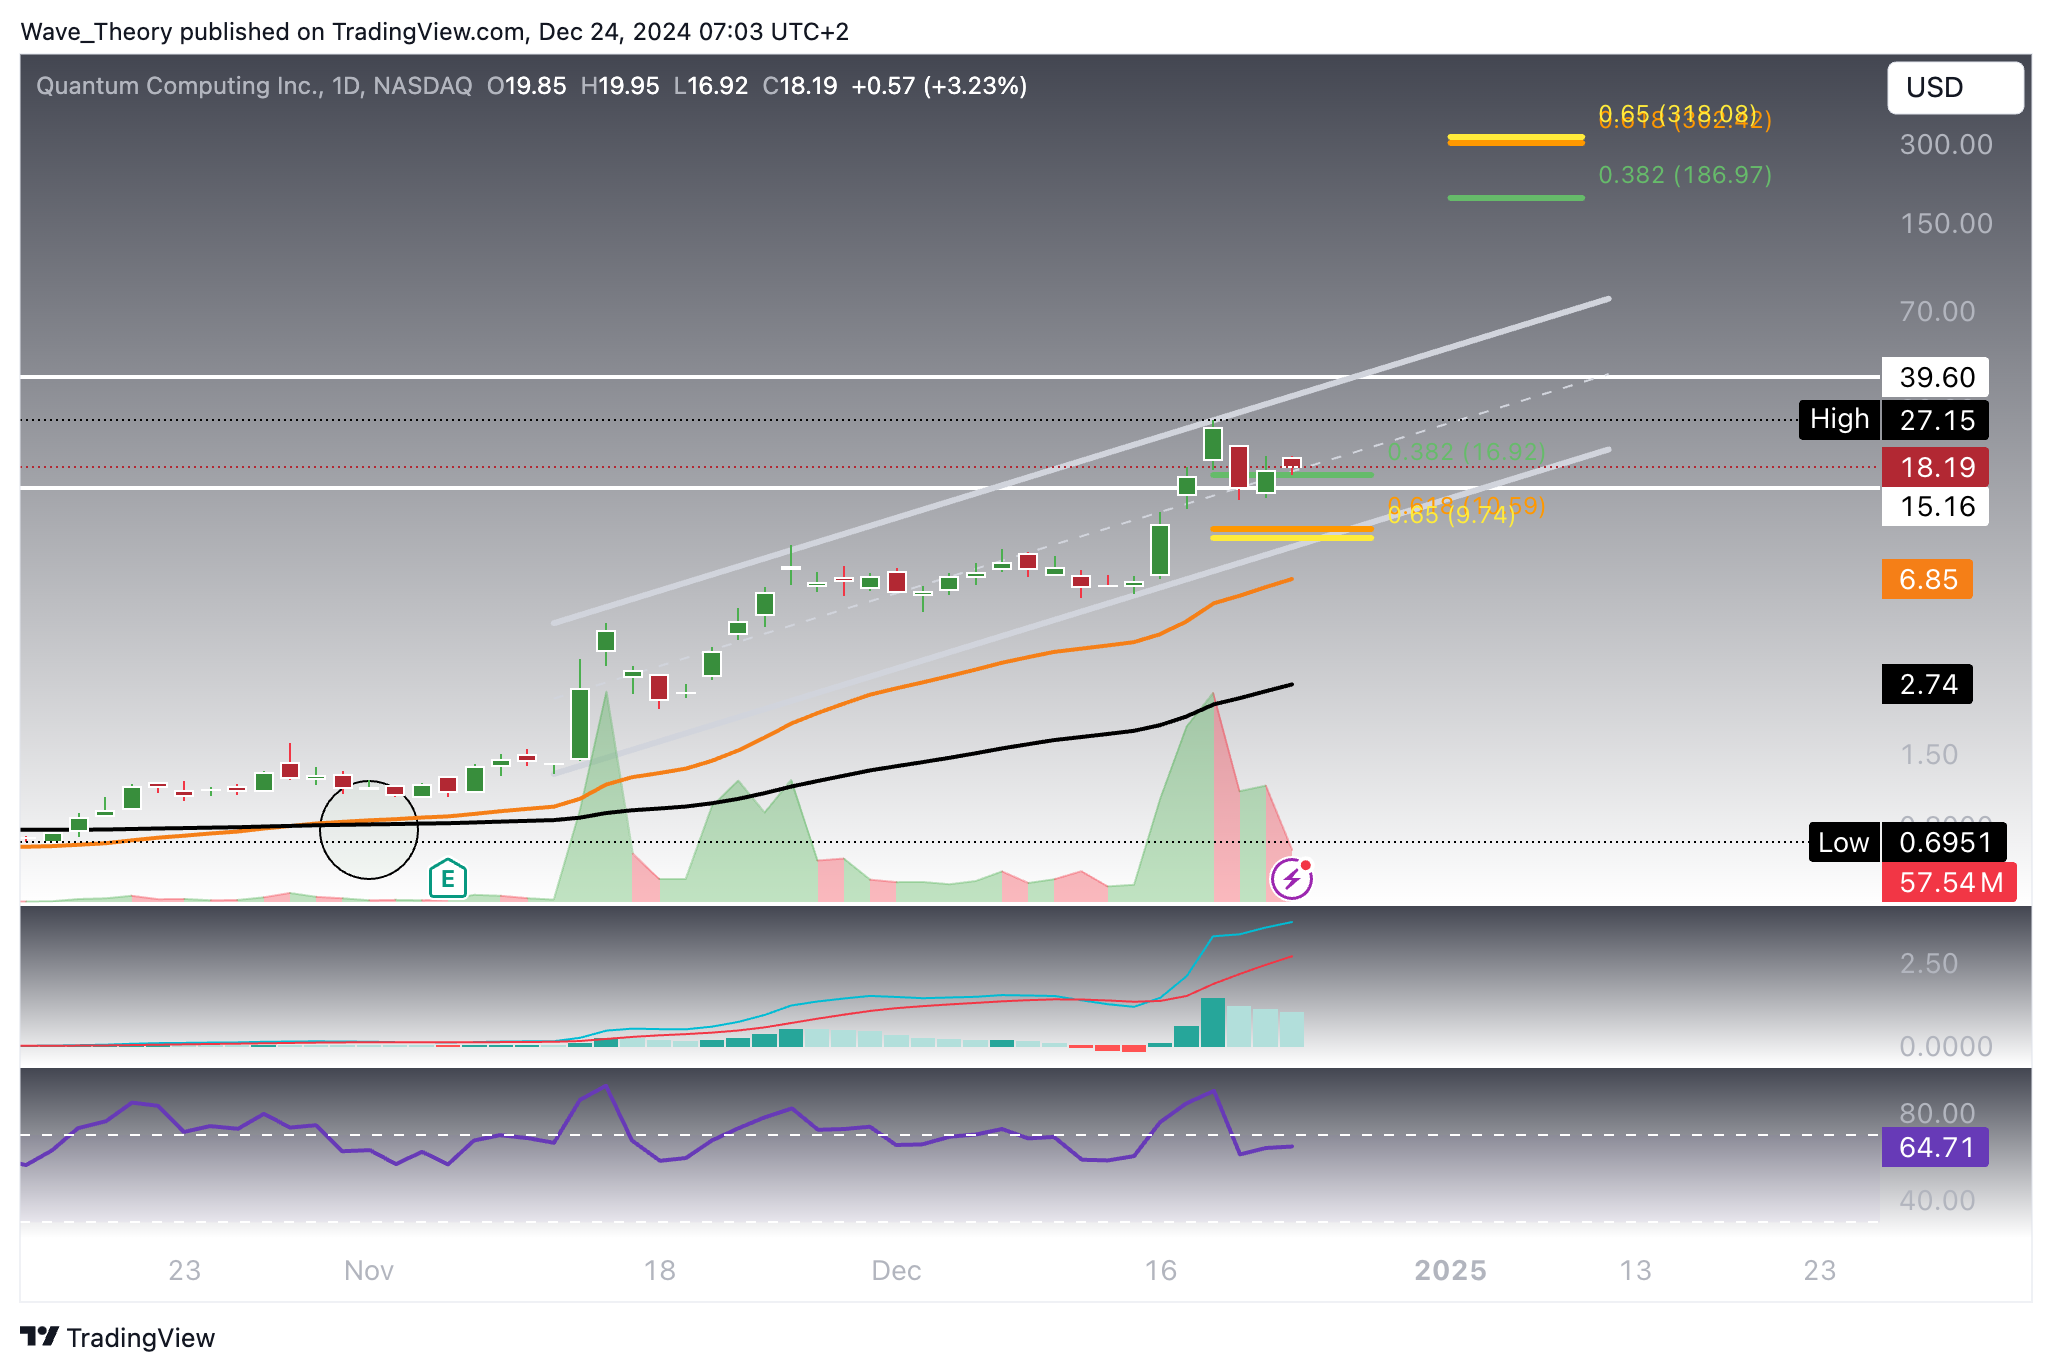
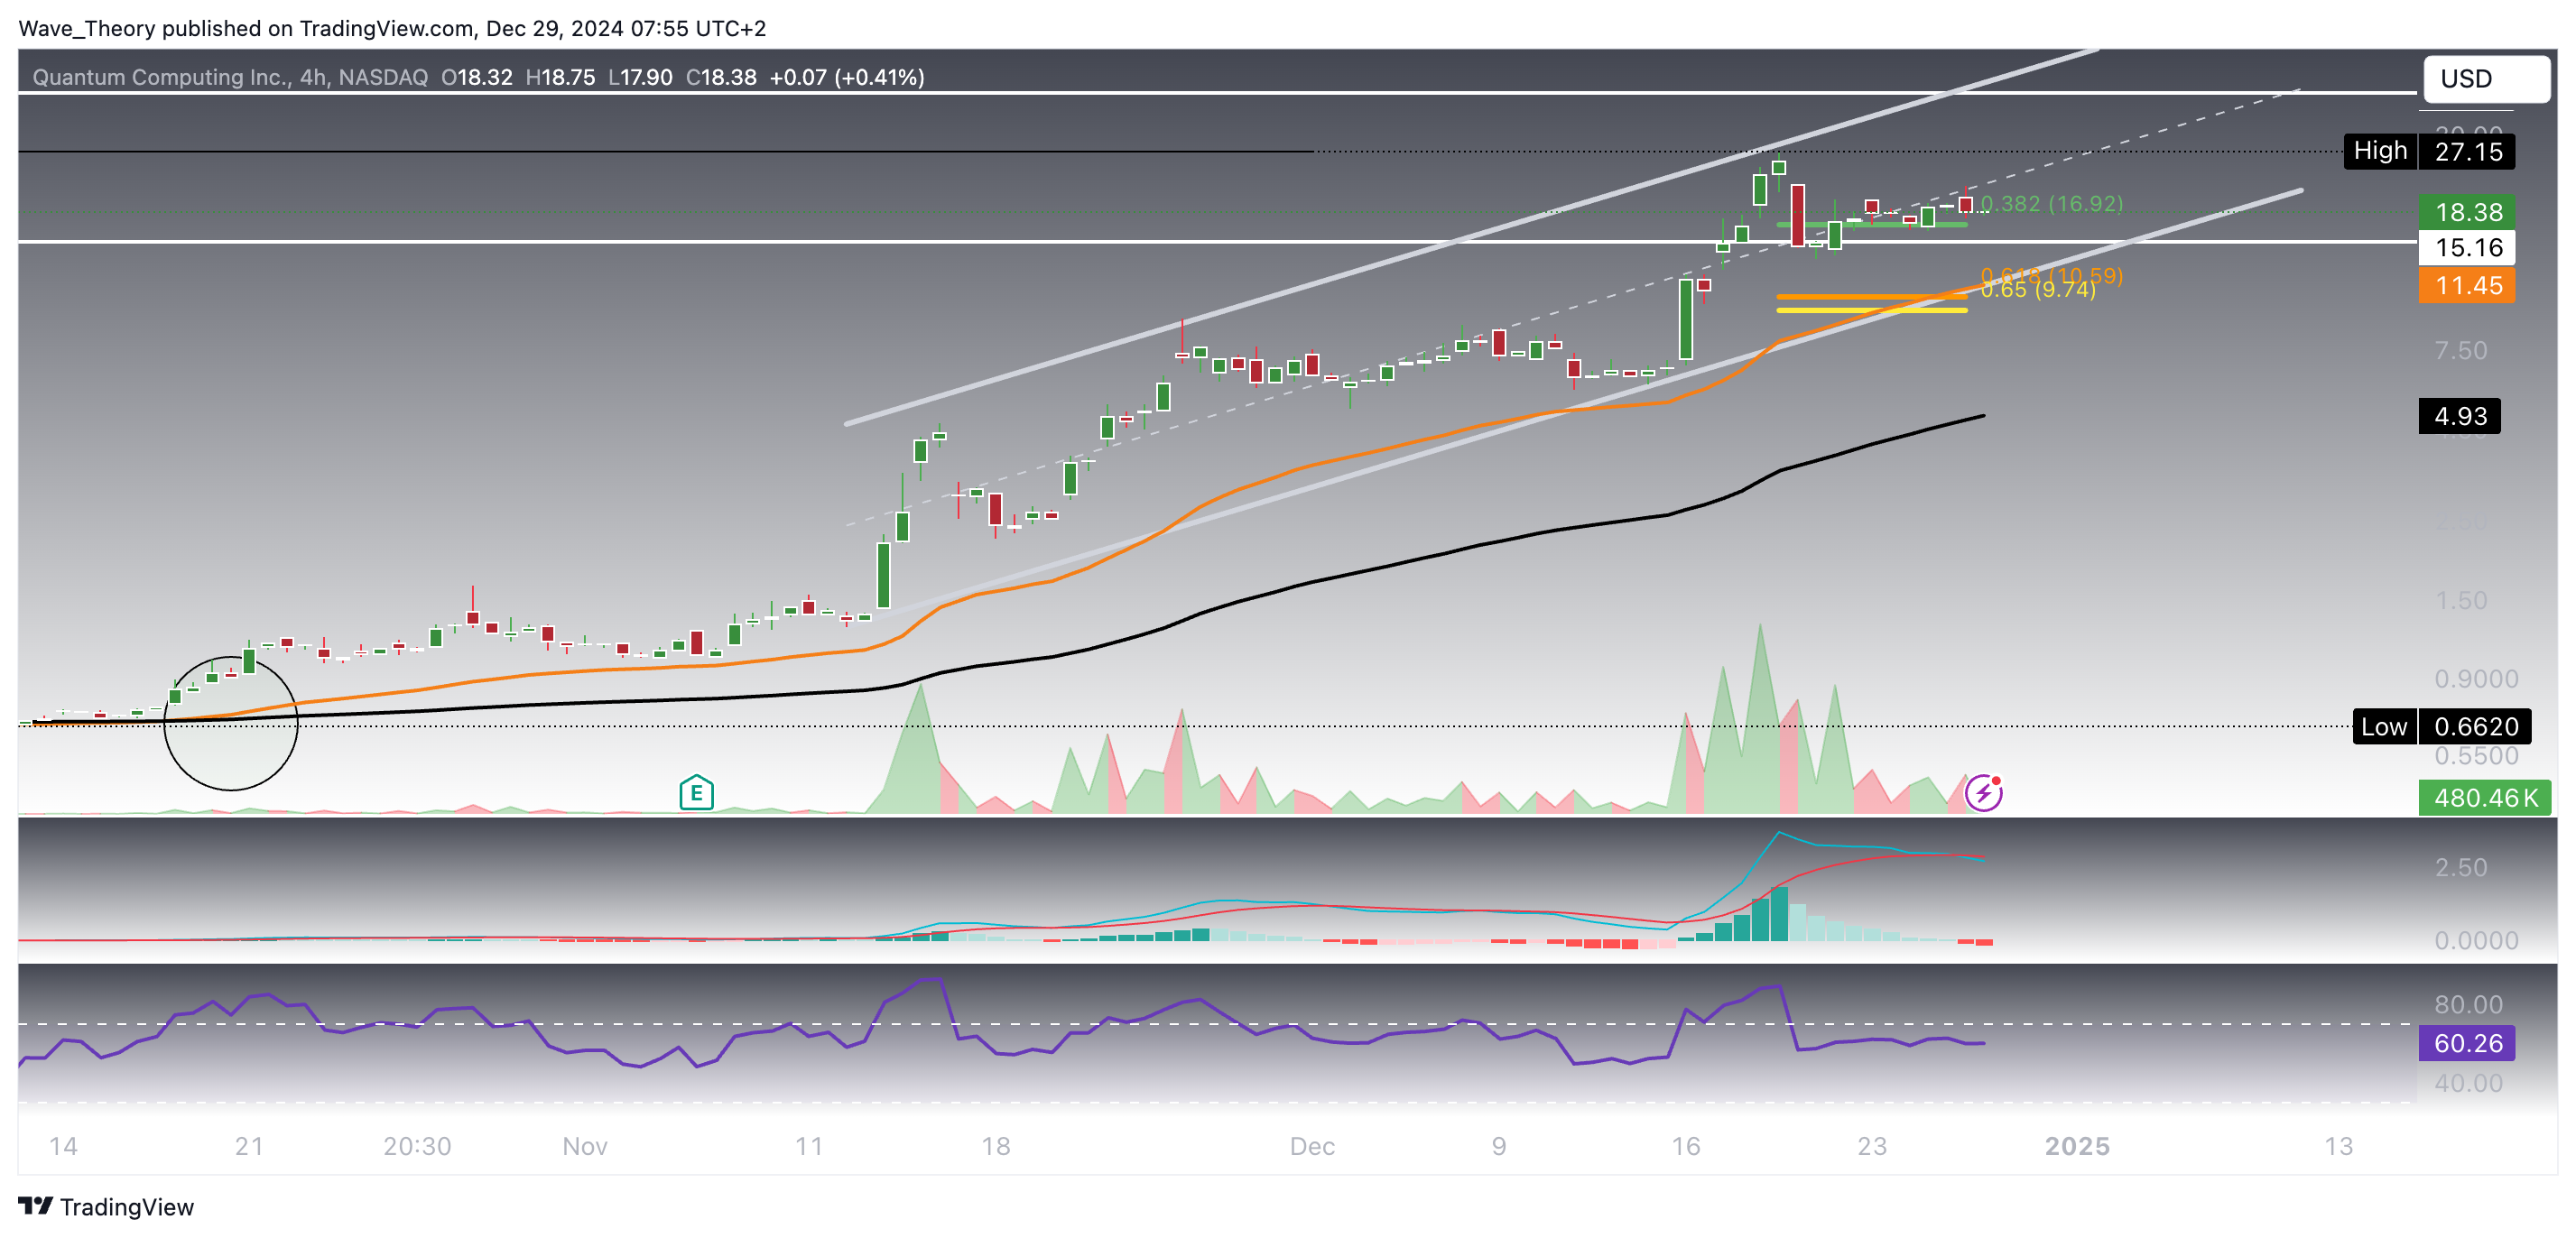
Quantum Computing Inc. (QUBT) Stock Surges Amid Breakthrough News and Market Hype
Broker | Review | Regulators | Min Deposit | Website | |
---|---|---|---|---|---|
🥇 | ![]() | Read Review | FCA, CySEC, ASIC, MAS, FSA, EFSA, DFSA, CFTC | USD 100 | Visit Broker |
🥈 | ![]() | Read Review | FSCA, FSC, ASIC, CySEC, DFSA | USD 5 | Visit Broker |
🥉 | ![]() | Read Review | CySEC, MISA, FSCA | USD 25 | Visit Broker |
4 | ![]() | Read Review | ASIC, BaFin, CMA, CySEC, DFSA, FCA, SCB | USD 200 | Visit Broker |
5 | ![]() | Read Review | ASIC, FCA, CySEC, SCB | USD 100 | Visit Broker |
6 | ![]() | Read Review | FCA, FSCA, FSC, CMA | USD 200 | Visit Broker |
7 | ![]() | Read Review | BVI FSC | USD 1 | Visit Broker |
8 | ![]() | Read Review | CBCS, CySEC, FCA, FSA, FSC, FSCA, CMA | USD 10 | Visit Broker |
9 | ![]() | Read Review | ASIC, CySEC, FSCA, CMA | USD 100 | Visit Broker |
10 | ![]() | Read Review | IFSC, FSCA, ASIC, CySEC | USD 1 | Visit Broker |
Quantum computing has gained significant attention recently, as breakthroughs in the field could potentially disrupt major security protocols, such as the SHA-256 encryption used by Bitcoin. These advancements have sparked interest across various sectors, with companies specializing in quantum technology experiencing substantial surges in stock prices. Among them, Nasdaq listed Quantum Computing Inc. (QUBT) has emerged as a prominent player. The Company’s products offer unique capabilities in the areas of high-performance computing, artificial intelligence, cyber security as well as remote sensing applications.
Quantum Computing Inc. (QUBT) Stock Surges 7,550 % Since July
Since July, Quantum Computing Inc. (QUBT) stock has surged by an astounding 7,550%, surpassing its 2020 highs and now facing major resistance between $15 and $39.6. A breakout above this zone could pave the way for a move toward significant Fibonacci levels at $187 and $315. Despite this rally, QUBT remains in a long-term downtrend dating back to 2009. To decisively reverse this multiyear bearish trend, the stock needs to break the golden ratio level at $315. On the monthly chart, indicators are strongly bullish, with the RSI in overbought territory without signaling bearish divergence, while the MACD lines are crossed bullishly and the histogram shows an uptrend.
Weekly Chart: A Golden Crossover is On The Horizon
On the weekly chart, the RSI shows signs of potentially forming a bearish divergence, signaling a possible imminent correction. However, other indicators remain largely bullish. The MACD lines are crossed bullishly, with the histogram ticking higher for the past two weeks, and the EMAs are on the verge of a bullish crossover, forming a golden cross that confirms the upward trend in the medium term.
QUBT Stock: Key Support Levels To Watch
On the daily chart, the EMAs have already formed a golden crossover, confirming a bullish trend in the short to medium term. Additionally, the MACD lines are crossed bullishly, while the RSI hovers in neutral zones. However, the MACD histogram has been ticking lower for the past three days, signaling weakening bullish momentum. If QUBT undergoes a correction, its next significant Fibonacci support levels lie at $16.92 and $10. As long as QUBT stays above the golden ratio at $10, the trend remains bullish. A bounce from these supports could lead to a re-test of resistance between $15 and $40.
4H Chart: Short Term Correction Likely
On the 4-hour (4H) chart, the exponential moving averages (EMAs) have confirmed a golden crossover, which supports the prevailing short-term bullish trend. QUBT stock has been moving upward within a parallel channel, indicating a structured rally. Additionally, the RSI is oscillating in neutral territory, showing no immediate overbought or oversold conditions.
Despite the bullish trend, the MACD lines have recently crossed bearishly, and the MACD histogram is reflecting downward momentum. These signals suggest that selling pressure is building, which could lead to a continuation of the current corrective phase. Given these mixed signals, the short-term outlook appears to favor an extension of the corrective movement before any further upward momentum resumes.
To summarize, QUBT has shown bullish momentum in the short to medium term, with the EMAs forming a golden crossover and the MACD lines crossed bullishly. However, a potential correction could target support levels at $16.92 and $10, while the overall trend remains bullish as long as it holds above the golden ratio at $10.

Sidebar rates
Related Posts
