Robinhood (HOOD) Stock: Is a Correction Due or a Bullish Target of $57 in Play?

BrokerReviewRegulatorsMin DepositWebsite
🥇Read ReviewFCA, CySEC, ASIC, MAS, FSA, EFSA, DFSA, CFTCUSD 100Visit Broker
🥈Read ReviewFSCA, FSC, ASIC, CySEC, DFSAUSD 5Visit Broker
🥉Read ReviewCySEC, MISA, FSCAUSD 25Visit Broker
4Read ReviewASIC, BaFin, CMA, CySEC, DFSA, FCA, SCBUSD 200Visit Broker
5Read ReviewASIC, FCA, CySEC, SCBUSD 100Visit Broker
6Read ReviewFCA, FSCA, FSC, CMAUSD 200Visit Broker
7Read ReviewBVI FSCUSD 1Visit Broker
8Read ReviewCBCS, CySEC, FCA, FSA, FSC, FSCA, CMAUSD 10Visit Broker
9Read ReviewASIC, CySEC, FSCA, CMAUSD 100Visit Broker
10Read ReviewIFSC, FSCA, ASIC, CySECUSD 1Visit Broker

Robinhood (HOOD) stock has recently surged to the resistance level at $44, surpassing the bullish target at the 0.382 Fibonacci level of $36.8. The key question now is whether Robinhood can break this current resistance and continue its upward trajectory towards the golden ratio level at $57. The technical outlook remains critical as traders watch for a potential breakout.

Robinhood (HOOD) Stock: Bullish Target at $57

Following our previous bullish forecast, Robinhood (HOOD) stock surged from $29 to $44, marking a 47 % increase. The stock successfully broke through the 0.382 Fibonacci resistance at $36.6, which now serves as significant support. Overall, the price has risen by over 90 % since the beginning of last month. While the RSI is nearing overbought levels, it has yet to give bearish signals. In fact, the MACD histogram has been ticking bullishly higher, with the MACD lines crossed in a bullish formation, suggesting continued upward momentum.

HOOD
HOOD

Robinhood Stock: Key Support Levels to Watch

On the weekly chart, the MACD histogram has been ticking bearishly lower for three consecutive weeks, although the MACD lines remain crossed bullishly, and the RSI is returning to neutral levels. Currently, Robinhood (HOOD) faces significant support at $36.6. If the stock breaks below this level, the next key Fibonacci support levels are at $30.1 and $20.5, with the 50-week EMA providing additional support at $24. This suggests a potential downside of 20 % to 46 %.

HOOD
HOOD

Robinhood (HOOD): Bearish Divergence Emerged On The Daily Chart

The daily chart for Robinhood (HOOD) reveals a bearish divergence in the RSI, which triggered a 22.4% price correction. Additionally, the MACD lines have crossed bearishly, and the histogram is trending downward. However, the EMAs are still indicating a golden crossover, supporting the overall bullish trend in the short- to medium-term. Despite this, short-term downside risk remains, but the mid-term bullish target of $57 is still achievable if HOOD can break past the $44 resistance.

HOOD
HOOD

Mixed Signals For The Robinhood Stock On The 4H Chart

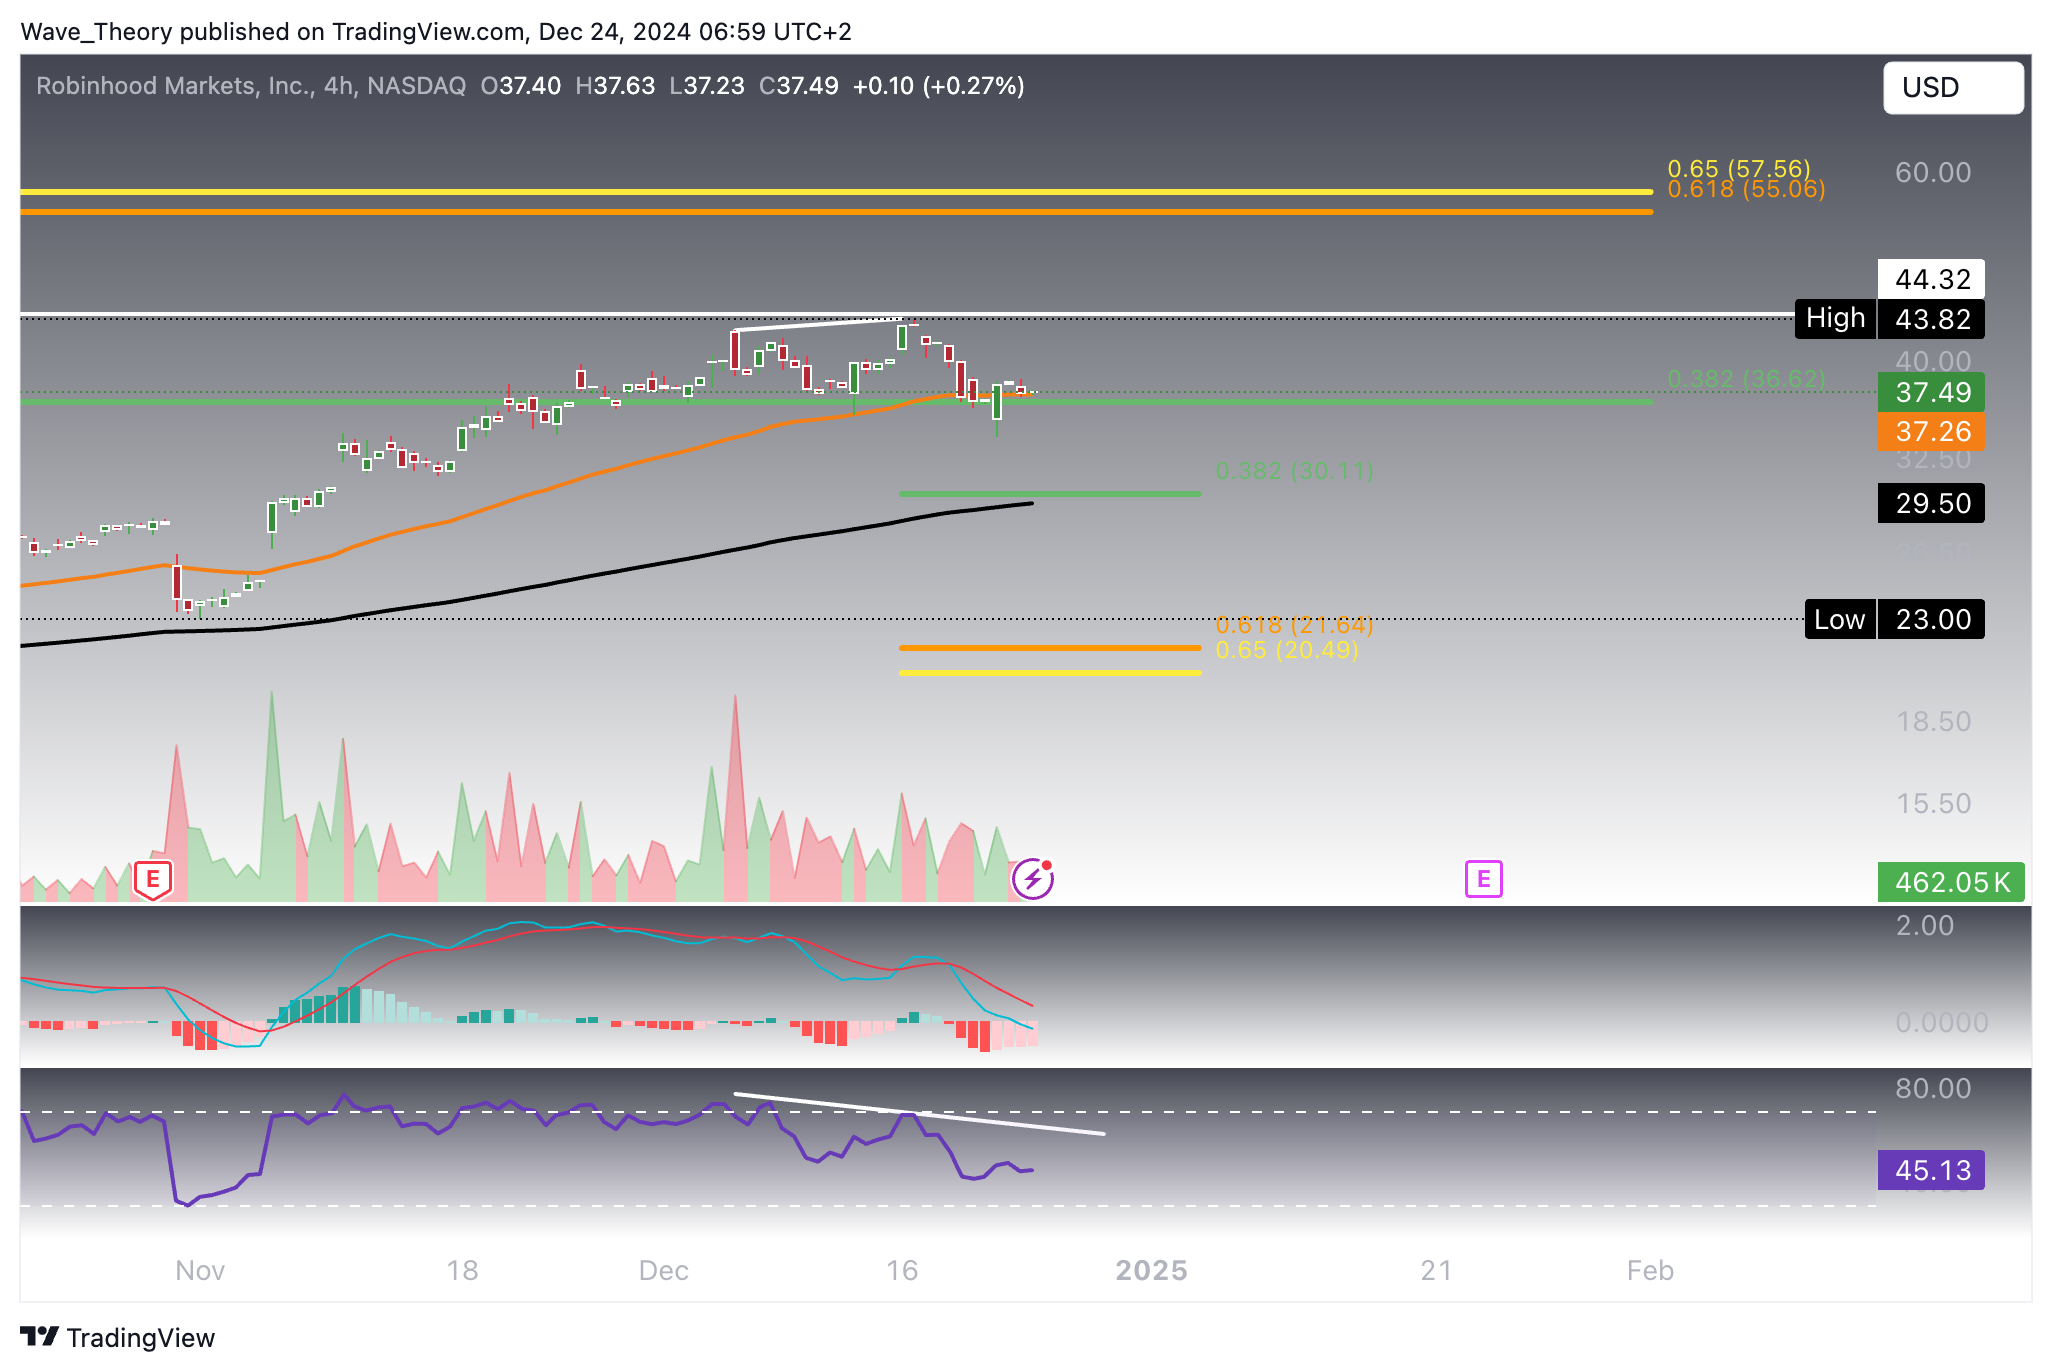
On the 4H chart, Robinhood’s indicators present mixed signals. While a bearish divergence in the RSI mirrors the daily chart, the RSI has now shifted to neutral, offering no clear bullish or bearish signals. The EMAs continue to show an intact golden crossover, suggesting a short-term bullish trend. Additionally, the MACD histogram is ticking higher, although the MACD lines remain crossed bearishly for now. In the short term, Robinhood has strong potential to bounce off its current support at $36.6 or the next Fibonacci support at $30, potentially retargeting the $44 resistance level.

HOOD
HOOD

To summarize, Robinhood (HOOD) stock shows mixed signals, with a bearish divergence on the daily and 4H charts, yet the golden crossover in the EMAs confirms a short-term bullish trend. A bounce off support at $36.6 or $30 could see the stock retarget resistance at $44, with potential upside towards $57 in the mid-term.

Check out our free forex signals
Follow the top economic events on FX Leaders economic calendar
Trade better, discover more Forex Trading Strategies
ABOUT THE AUTHOR See More
contact.me.konstantin@gmail.com
Konstantin Kaiser
Financial Writer and Market Analyst
Konstantin Kaiser comes from a data science background and has significant experience in quantitative trading. His interest in technology took a notable turn in 2013 when he discovered Bitcoin and was instantly intrigued by the potential of this disruptive technology.
Related Articles
Comments
0 0 votes
Article Rating
Subscribe
Notify of
0 Comments
Oldest
Newest Most Voted
Inline Feedbacks
View all comments