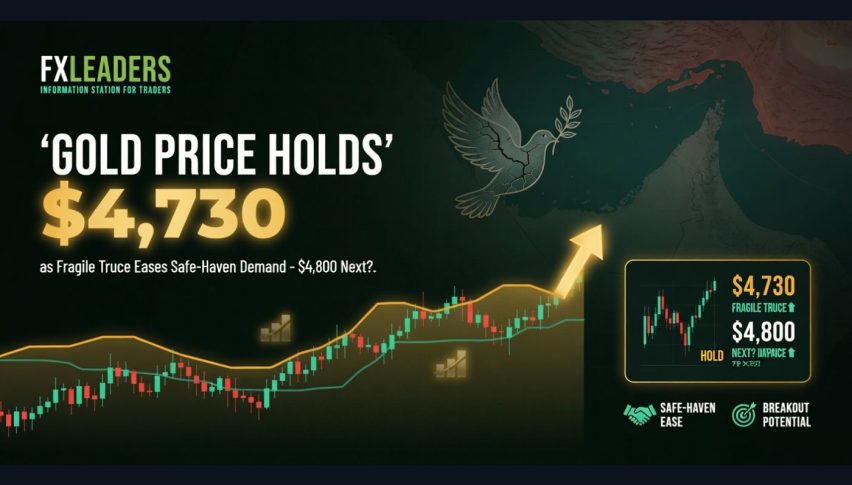
Gold Price Holds $4,730 as Fragile Truce Eases Safe-Haven Demand – $4,800 Next?
On the morning of May 7, 2026, spot gold (XAU/USD) is trading around $4,729 per ounce. The price is down about 0.14% for the day...
Quick overview
- Spot gold is trading at approximately $4,729 per ounce, down 0.14% for the day.
- A conditional ceasefire between the U.S. and Iran has reduced geopolitical risks, impacting gold demand.
- Central banks, particularly China, continue to buy gold, supporting prices with a net purchase of 244 tonnes in Q1 2026.
- Technical analysis shows gold is testing key resistance levels, with bullish momentum indicated by the RSI.
On the morning of May 7, 2026, spot gold (XAU/USD) is trading around $4,729 per ounce. The price is down about 0.14% for the day and remains within a tight range.
Main Factors Influencing Gold Today
- Ceasefire Stability: The conditional ceasefire between the U.S. and Iran is nearing one month and has allowed some tanker traffic to resume through the Strait of Hormuz. This has eased much of the geopolitical risk that pushed gold higher in March and early April, but ongoing tensions still keep some safe-haven demand in place.
- Central Bank Support: Central banks continue to support gold prices. China has been buying gold for over 17 months in a row, and other emerging markets are also adding to their reserves. In the first quarter of 2026, global central banks bought a net 244 tonnes, which is above the five-year average.
- Macro Shift: As geopolitical tensions ease, attention is shifting to upcoming U.S. inflation data and what the Federal Reserve might do next. Earlier, rising energy prices helped gold act as an inflation hedge, but recent calm has reduced some of that pressure.
- Longer-Term Outlook: Ongoing geopolitical risks, moves away from the U.S. dollar, and demand for inflation protection all support positive forecasts. Several major banks expect gold prices to reach or even exceed $5,000 per ounce by the end of the year.
Gold (XAUUSD) Technical Analysis
Gold spot (XAUUSD) is holding just below the upper ascending trendline after moving past previous highs and the moving average resistance near $4,700. The price is staying within a steep channel from early May lows and is now testing the 0.0 Fibonacci extension area.
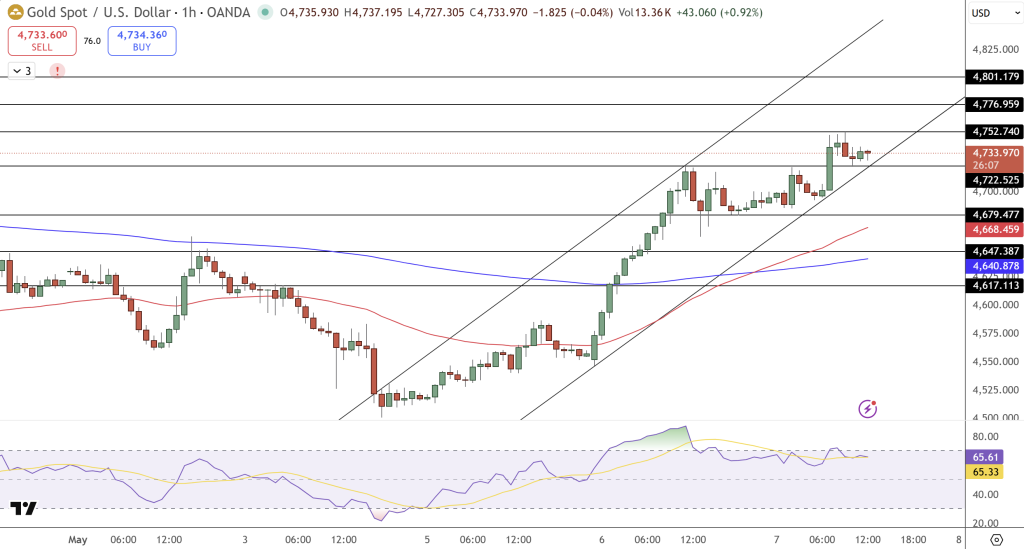
Yellow and cyan MAs fan bullish underneath, offering layered dynamic support around $4,680–$4,700. The structure displays higher lows with measured channel projection targeting $4,776–$4,801. RSI holds steady near 63–65, maintaining bullish momentum without overbought exhaustion.
Important Price Levels:
- Resistance: $4,752 → $4,776
- Support: $4,722 → $4,679
Trade Idea: Buy above $4,735 targeting $4,776–$4,801, stop below $4,722.
In the short term, gold’s price will be influenced by how the truce holds, upcoming U.S. economic data, and overall market risk appetite. Over the longer term, steady central bank buying continues to support the fundamentals.
- Check out our free forex signals
- Follow the top economic events on FX Leaders economic calendar
- Trade better, discover more Forex Trading Strategies
- Open a FREE Trading Account
- Read our latest reviews on: Avatrade, Exness, HFM and XM
Related Articles

Sidebar rates
Related Posts
