WTI Crude Price Weekly Outlook: Will Triangle Support Spark a Move Back Over $94?
WTI Crude Oil (USOIL) plunges 9% to test a massive multi-month symmetrical triangle support floor at $87.75. Read our expert price forecast.
Quick overview
- WTI Crude Oil closed at $87.75 after a sharp decline, approaching the lower limit of a symmetrical triangle structure on the 4-hour chart.
- The US-Iran ceasefire has improved oil flow through the Strait of Hormuz, reducing the war-time risk premium on crude prices.
- Anticipated OPEC+ supply increases and a hawkish Federal Reserve are influencing market sentiment and price expectations for WTI Crude.
- A potential reversal is indicated by the oversold RSI and narrowing price range, with key resistance levels at $92.59 and $94.85.
WTI Crude Oil faces critical technical confluence this week, declining sharply to close Friday’s session at $87.75 following a heavy 1.28% intraday liquidation. WTI Crude (USOIL) currently experiences a dramatic reduction in price range, as it approaches testing the lower limit of a large symmetrical triangle structure displayed in the 4-hour chart. This intense price compression reflects cooling war-time sentiment and expected OPEC+ supply increases and Federal Reserve interest rate changes.
This Week’s Top Price Influences
- US-Iran Ceasefire Choke Point Data: The eight-week-old truce between the US and Iran is functioning smoothly, as the strategic oil transportation corridor through the Strait of Hormuz has recovered to approximately 75 to 80% of pre-crisis flow. The ongoing normalization of oil flow through the Gulf has successfully alleviated the war time risk premium that helped push crude towards multi-month peaks.
- Anticipated OPEC+ Supply Changes: Attention is on the June 7, 2026 OPEC+ ministerial committee meeting. Seven core alliance members expect to confirm an increase of 188,000 barrels of oil per day (bpd) for July, further reversing previous supply curtailments following the UAE exit.
- Federal Reserve Watch: The Federal Reserve remains in hawkish mode following Kevin Warsh’s official appointment. As of April, US CPI inflation holds at 3.8%, diminishing prospects of an imminent rate cut and supporting a robust U.S. Dollar Index.
WTI Crude Oil (USOIL) Technicals Outlook
WTI Crude oil (USOIL) displays a narrowing range on the 4-hour timeframe. WTI Crude oil (USOIL) trades against its lower green trendline of the triangle, drawn through points A, B, C, and D, at $87.75 following its earlier rejection from the triangle’s upper trendline. WTI Crude oil (USOIL) tests multi-month horizontal support after a sell-off that dropped it out of the range at $92.59 to $94.85.
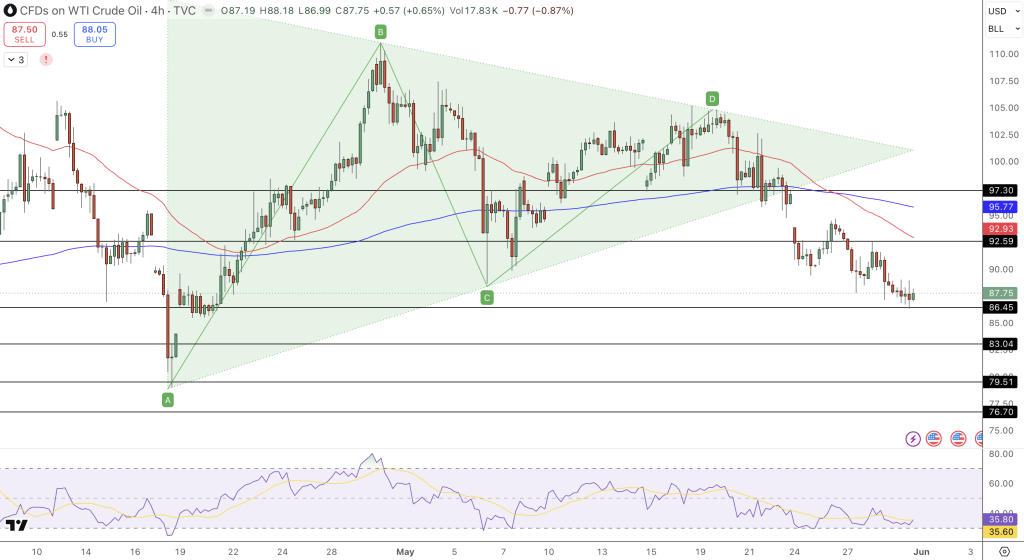
The relative strength index (RSI) is oversold in the 35-40 range, as WTI Crude oil (USOIL) volume decreases towards the lower apex of the triangle. The extreme RSI low, low volume, and narrowing triangle all point towards a potential reversal in the near term, although the bulls must first clear the $94.85 high and then the $98.56 upper trendline and horizontal resistance.
- Key Resistance: $92.59, $92.59 to $94.85 (Wedge upper limit), and the upper diagonal trendline at $98.56
- Key Support: $87.75 (Lower trendline), and $86.45 (Horizontal support) and $83.04
Trade Idea
We have identified a high probability asymmetric setup with the current narrowing wedge.
- Order: Buy on the next daily close above $92.59 (Buy Stop)
- Target: $94.85, then $98.56
- Stop Loss: Tight Stop at $86.45 or below
Conclusion
WTI Crude Oil (USOIL) Price Forecast is for a multi-month test of structural demand near the upper limit of the 4-hour chart. While increased non-OPEC+ supply has buffered US WTI Crude (USOIL) from a full-blown technical breakdown, long-term underinvestment in new oil sources continues. WTI Crude (USOIL) price is set for a significant breakout following the upcoming quota adjustments from OPEC+.
- Check out our free forex signals
- Follow the top economic events on FX Leaders economic calendar
- Trade better, discover more Forex Trading Strategies
- Open a FREE Trading Account
- Read our latest reviews on: Avatrade, Exness, HFM and XM

Related Articles

Sidebar rates

Related Posts
 Save
Save