Intel Stock Crashes After Explosive Rally: Healthy Correction or Trend Reversal?
Quick overview
- Intel's stock has experienced a significant correction after a 705% rally, now testing critical support at the 0.382 Fibonacci level of $92.58.
- If the current support fails, the next major support zones are between $69.29 and $75.45, and the Golden Ratio support at $57.66 to $61.82.
- Despite the recent decline, long-term indicators suggest a bullish trend remains intact as long as key support levels hold.
- Short-term momentum indicators are bearish, indicating potential for further downside before a possible recovery.
Intel (NASDAQ: INTC) has entered a sharp correction after rallying more than 700% from its 2025 low to a new all-time-high at $142.35. Following this extraordinary advance, profit-taking has accelerated, sending the stock back toward a critical support cluster where several key technical levels converge.
Intel Stock Crashes After Explosive Rally: Healthy Correction or Trend Reversal?
Despite the recent decline, Intel continues trading well above its long-term breakout zone, and the broader structure remains constructive as long as major Fibonacci supports continue to hold. Investors are now watching whether the current correction presents another buying opportunity or marks the beginning of a deeper retracement.
Intel Stock Tests Major Long-Term Support After Historic Rally
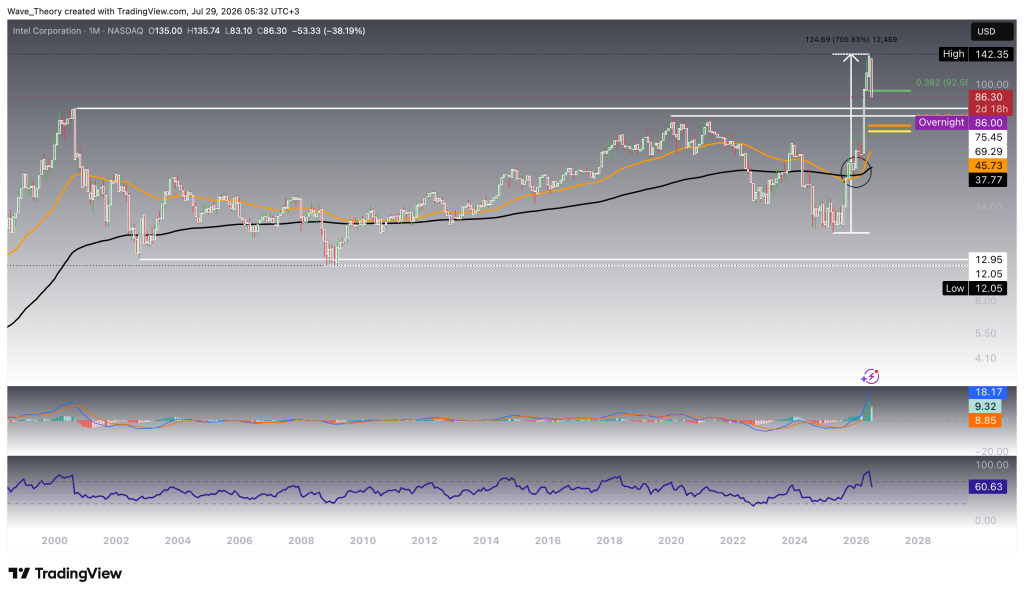
On the monthly chart, Intel recently completed one of its strongest rallies in decades, surging more than 705% from its 2025 low before reaching a new multi-year high at $142.35. Since then, the stock has entered a healthy correction and is now approaching the 0.382 Fibonacci support at $92.58.
Should this support fail, the next major Fibonacci support awaits at the Golden Ratio between $57.66 and $61.82, implying downside of roughly 29% to 33% from current levels.
Despite the correction, Intel continues trading well above both the 50-month EMA at $45.73 and the 200-month EMA at $37.77, confirming that the long-term trend remains strongly bullish. The recent rally also established a fresh golden crossover between the long-term moving averages, further strengthening the primary trend.
Momentum indicators, however, suggest that bullish momentum is cooling. The MACD lines remain bullishly crossed, while the MACD histogram has begun ticking lower, indicating weakening upside momentum. Meanwhile, the RSI remains in neutral territory, leaving room for the correction to continue before oversold conditions emerge.
Weekly Chart Points Toward Key Fibonacci Support
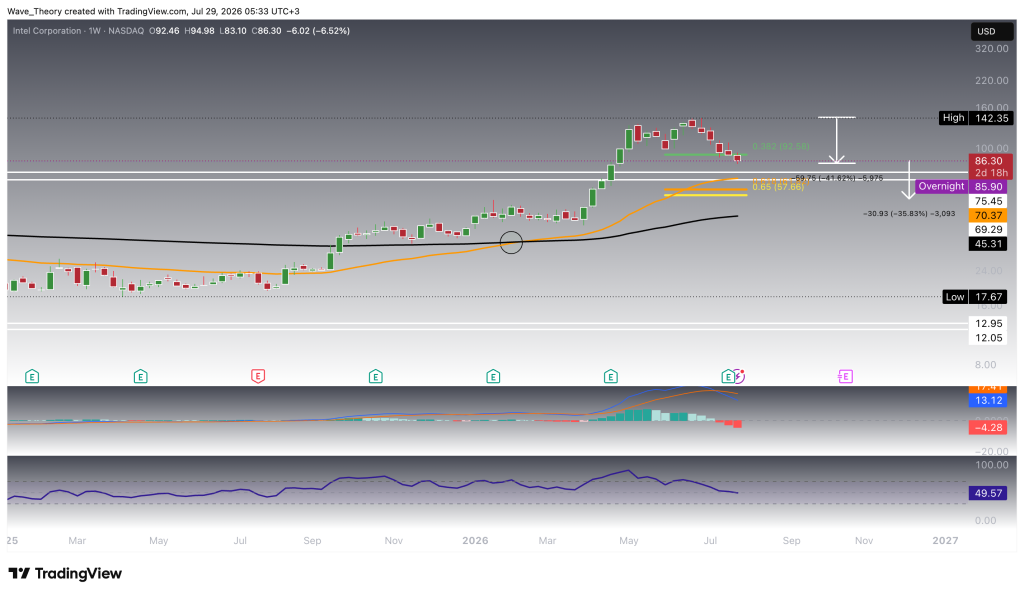
On the weekly chart, Intel has been correcting steadily after topping out at $142.35. The stock is now potentially breaking the 0.382 Fibonacci support at $92.58 bearishly, which represents the first major technical support.
A break below this level could accelerate the correction toward the resistance-turned-support zone between $69.29 and $75.45, where the 50-week EMA also provides additional support. Beneath that, the Golden Ratio support between $57.66 and $61.82 represents the next major bullish reversal zone.
If Intel successfully defends the current Fibonacci support, the stock could resume its broader uptrend and initially recover toward its previous high near $142.35, implying upside of roughly 65%.
The momentum indicators currently favor the bears. The MACD lines are bearishly crossed, while the MACD histogram has been ticking lower for several consecutive weeks, confirming weakening bullish momentum. The EMAs continue displaying a golden crossover, preserving the medium-term bullish trend. Meanwhile, the RSI remains in neutral territory, allowing additional downside before reaching oversold conditions.
Intel (INTC) Trades Below the 0.382 Fibonacci Support on the Daily Chart
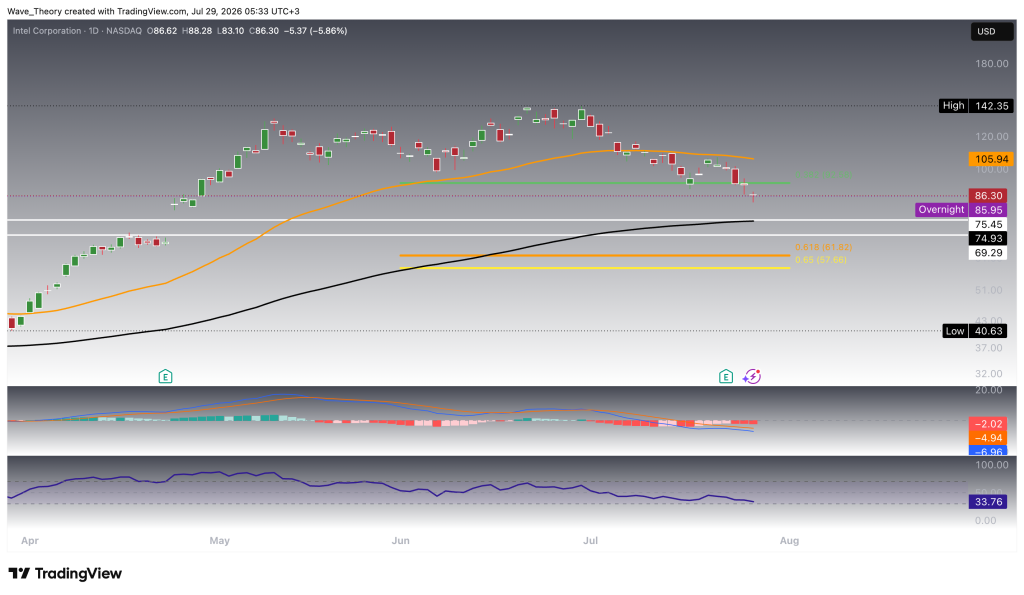
On the daily chart, Intel stock recently broke below the 0.382 Fibonacci support at $92.58, placing the next support zone between $69.29 and $75.45 into focus.
The stock is also trading below the 50-day EMA at $105.94, while the 200-day EMA at $74.93 continues rising toward the next support cluster. As long as Intel remains above the Golden Ratio support between $57.66 and $61.82, the broader bullish structure remains intact despite the ongoing correction.
Momentum indicators continue favoring the bears. The MACD lines remain bearishly crossed, while the MACD histogram continues printing lower bars, confirming strengthening bearish momentum. The EMAs still maintain a golden crossover, confirming that the medium-term trend remains bullish despite the recent weakness. Meanwhile, the RSI is approaching oversold territory, suggesting that selling pressure could gradually become exhausted.
Intel Slips Below the 200-4H EMA
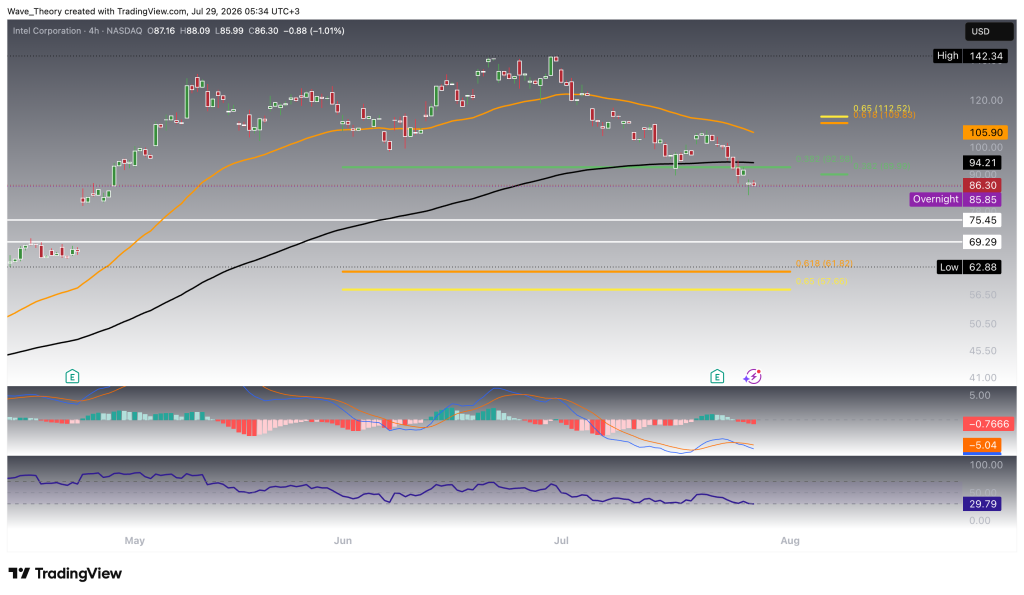
On the 4-hour chart, Intel recently broke below both the 50-4H EMA and the 200-4H EMA around $94.21, confirming that the short-term trend has turned bearish.
The next important support remains between $69.29 and $75.45, while the stronger Golden Ratio support continues to sit between $57.66 and $61.82. Should Intel bounce off bullishly the gtolden ratio support at roughly $60, the first upside target would be the 0.382 Fibonacci resistance at $90, followed by the resistance zone near $109.83–$112.52.
Momentum indicators continue supporting the bearish outlook. The MACD lines remain bearishly crossed, while the MACD histogram continues ticking lower, reflecting increasing downside momentum. The EMAs are close to forming a death cross, which would further confirm the short-term bearish trend. Meanwhile, the RSI has entered oversold territory, leaving room for a technical relief rally if buyers return.
Intel (INTC) Price Prediction: Summary
Intel stock remains in a healthy corrective phase following its extraordinary 705% rally to $142.35. The stock is now approaching its first major long-term support at the 0.382 Fibonacci level of $92.58, where buyers could attempt to stabilize the decline.
If this support fails, the next major support lies between $69.29 and $75.45, followed by the Golden Ratio support between $57.66 and $61.82. Conversely, a successful defense of the current Fibonacci level could allow Intel to resume its primary uptrend toward its previous high.
Although short-term momentum continues favoring the bears, the monthly, weekly, daily EMA and 4H structures continue displaying golden crossovers, confirming that the broader trend remains bullish. As long as Intel holds above the Golden Ratio support zone, the long-term technical outlook remains constructive despite the ongoing correction.
- Check out our free forex signals
- Follow the top economic events on FX Leaders economic calendar
- Trade better, discover more Forex Trading Strategies
- Open a FREE Trading Account
- Read our latest reviews on: Avatrade, Exness, HFM and XM

Related Articles

Sidebar rates

Related Posts
 Save
SaveAva