Forex Signals Brief for May 25th – Steady FOMC Dumps The Greenback
At long last, the FED FOMC meeting minutes are out… but they failed to surprise the market. Most of the outcome was already anticipated. Though the FOMC wasn't dovish, still we experienced a dip in the Buck.
Nonetheless, the behavior was pre-anticipated and came as no surprise. As we discussed in our update Forex Signals Brief May 24th, the demand for dollar was underpinned by the hawkish sentiment of investors. Thus, the dollar was already "priced in" and an almost neutral FOMC failed to convince buyers to hold the U.S dollar.
According to the FOMC, it's prudent to wait for additional evidence that the fresh weakness in the data was transitory ahead of hiking rates. At one side, few participants expect that inflation would stabilize to the 2% target over the medium term, as the import prices had started to rise.
On the flip side, few of the members still feel uncertain about the recent weakness in the inflation figures. As a result, the investors switched their investments from the U.S dollar into less risky assets such as bullion and peer currencies.
Top Economic Events To Watch Today
USD
- Unemployment Claims (12:30)
- OPEC Meetings (All Day)
- FOMC Member Brainard Speaks (14:00)
GBP
- Second Estimate GDP q/q (8:30)
- Prelim Business Investment q/q (8:30)
NZD
- Annual Budget Release (NZD)
AUD
- RBA Assist Gov Debelle Speaks (8:00)
EUR/USD – Bulls Dominated Currency Pair
The Euro strengthened against the greenback on the release of FOMC meeting minutes. It traded exactly as we reckon in Forex Signals Brief May 24th, as $1.1165 was the significant level to enter a buy position with a stop loss below $1.1135 and a take profit at $1.1235. Thankfully, the forex trading signal closed at the take profit level.
Besides that, the European Central Bank (ECB) President Mario Draghi was highly in focus but, just like FOMC, he also disappointed the bulls by suggesting that the monetary policy is likely to remain unchanged at the upcoming meeting on June 8.
Forex Trading Signal
Today there is a need to watch over the key level $1.1210 as we may take a buy position above this level, with a stop loss below $1.1185 and a take profit of $1.1270.
.jpg) EURUSD – 4 Hours Chart
EURUSD – 4 Hours Chart
Technical Outlook – Intraday
In the Asian trading session, the market is exhibiting a thin volume and volatility as most of the investors are out after the dovish remarks from the Mario Draghi and the FOMC meeting minutes.
For now, the pair holds above the 50- periods EMA, demonstrating the bullishness in the pair. Whereas, our technical friends, the RSI and Stochastics are supporting a bullish bias in the pair.
Sooner or later, the pair is likely to form a double top pattern in the 4-hours chart at $1.1260. That's the point where we can expect a retracement in the market. Anyways, let's have a look at the major trading levels for the day.
Support Resistance
1.1184 1.1235
1.1151 1.1253
1.1133 1.1286
USD/JPY – Bearish Flag, Sellers Awaited
Since a couple of days, the Japanese Yen is trading sideways against the U.S dollar. Both the fundamentals and technical analyses are complimenting each other and suggesting a bearish trend in the haven currency pair.
Just like other currency pairs, the USD/JPY was also influenced by Federal Reserve's minutes – and these reflected concerns over the Inflation targets and worries about the upcoming rate hikes. As a result, the pair dropped below $112.650.
Forex Trading Signal
Today, taking a sell position below $111.400 with a stop loss above $111.700 and a take profit of $110.950 seems to be a good idea.
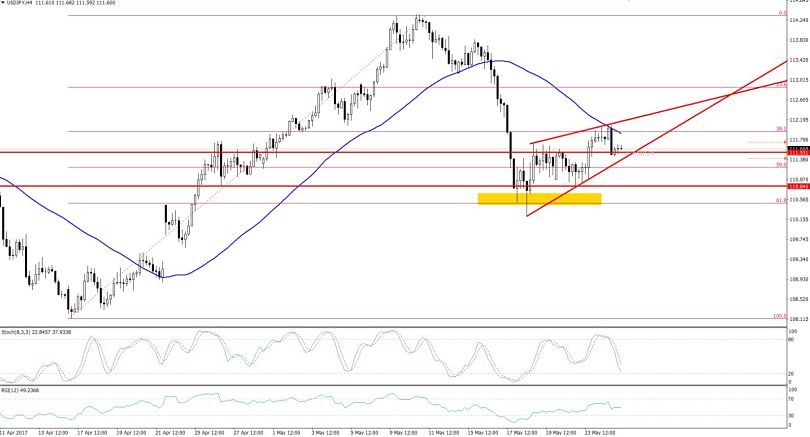 Bearish Flag USDJPY – 4 Hours Chart
Technical Analysis – Intraday
We can see that the USD/JPY has been stuck in the narrow trading range of $110.500 – 112.400 and this range is defined by Fibonacci trading levels.
On the daily chart, the market became overbought and fell down to complete the 61.8% Fibonacci trading level of $110.500. Later, the market pushed the prices back to the upside.
Most importantly, the pair has formed a bearish flag pattern on the 4-hours timeframe, which demonstrates that the bearish breakout is imminent. However, the lagging indicator (50-periods moving average) is also pointing to a trend in the major currency pair
Support Resistance
111.26 111.92
111.03 112.35
110.6 112.58
Ending Remarks
Before summing up, let me draw your attention towards our newly added article on EUR/USD, USD/JPY, GBP/USD, and Gold which are specifically designed to help you guys understand everything about trading these instruments.
Today we may encounter a thin volatility in the Asian and early European trading sessions, and the New York session is likely to show some action, particularly with the release of high-impact Unemployment Claims – due at 12:30 GMT. So stay tuned for exciting trade opportunities ahead!
- Check out our free forex signals
- Follow the top economic events on FX Leaders economic calendar
- Trade better, discover more Forex Trading Strategies
- Open a FREE Trading Account
- Read our latest reviews on: Avatrade, Exness, HFM and XM
Related Articles


Sidebar rates
Related Posts
