Gold Breakout of Descending Triangle – What’s Next?
Gold continues to trade bearish on Tuesday despite all the bullish fundamentals. Looks like, the stronger dollar is overshadowing the...
Gold continues to trade bearish on Tuesday despite all the bullish fundamentals. Looks like the stronger dollar is overshadowing the uncertainty spread by the POTUS. The technical outlook for gold is also bearish. Check it out…
Gold – XAU/USD – Fundamental Analysis
Recalling our previous update Sideways Trading In Gold – Trade War Tension Escalates, the trade war sentiments escalated due to the comments made by the President of United States. Trump is considering listing China’s investment in U.S. companies as a threat to economic and national security.
However, the U.S. Treasury Secretary Steven Mnuchin remarked that the investment restrictions will not be specific to China but would apply “to all countries that are trying to steal our technology.”
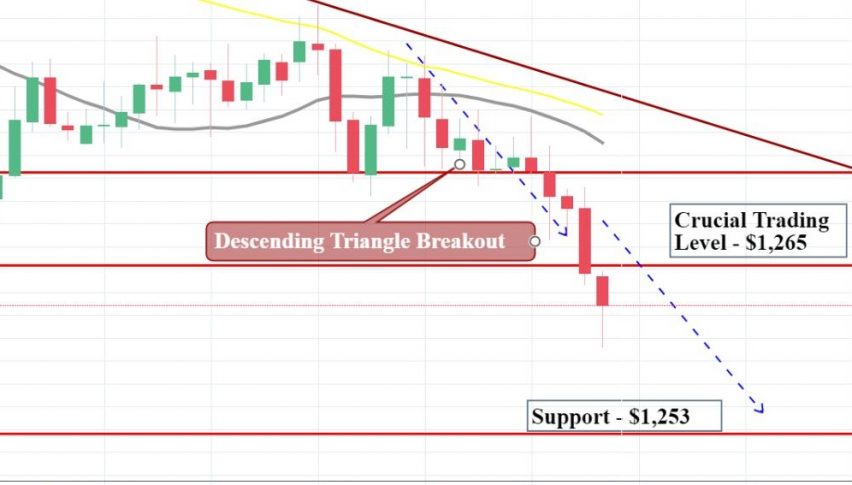
Gold remained supported over the news but the horizontal trendline resistance of $1,267 is giving it a hard time. Actually, gold was trading in a descending triangle pattern which was violated at $1.265 on the lower side.

Presently, gold is facing a resistance near $1,262 along with a support near $1,257. The 50 – periods EMA is supporting the bearish trend. The violation of $1,257 can extend the bearish rally towards $1,251. Whereas above $1,261, the market can stay bullish until $1,265.
Gold – XAU/USD – Trade Idea
I’m placing my sell limit near $1,262 with a stop near $1,265 and take profit at $1,253. Good luck!
- Check out our free forex signals
- Follow the top economic events on FX Leaders economic calendar
- Trade better, discover more Forex Trading Strategies
- Open a FREE Trading Account
- Read our latest reviews on: Avatrade, Exness, HFM and XM
Related Articles


Sidebar rates
Related Posts
