Gold Returns Back Down to the 200 SMA
Gold turned bearish yesterday after the US ISM non-manufacturing report, but the 200 SMA is holding the range
GOLD has been quite volatile this year, especially in Q2 when it surged around $280 higher as the global economy fell on its backside. But, the sentiment improved in the last two months and the volatility has declined. Gold slipped lower in September, but in October Gold has been trading mostly sideways.
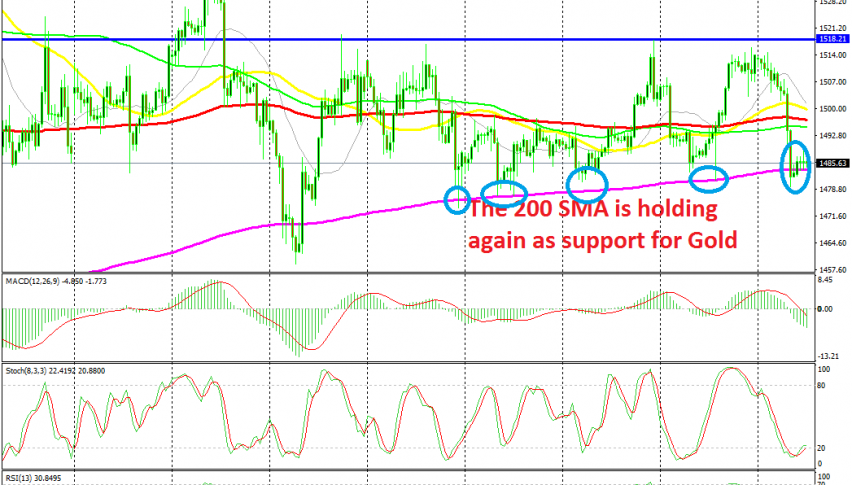
As we can see from the H4 chart above, Gold has been finding support at the 200 SMA (purple). The range narrowed considerably in the second half of last month, but we have seen spikes to the upside, suggesting that Gold traders are pretty cautious to the sentiment in financial markets. As soon as there is some deterioration in the sentiment, buyers have jumped in.
Gold has formed a resistance area around the $1,518 level. We have seen gold move to that area several times in the last two months and reverse back down from there. Last week we saw Gold move higher after the FED cut interest rates for the third time and let markets know that the most probable move in the future for interest rates would be down, rather than up.
As a result, the USD turned bearish and Gold surged higher. But, the climb stopped right at the resistance level. Then, we saw a big decline yesterday after the US ISM non-manufacturing PMI came in much stronger than expected, reversing the softening trend and improving the sentiment. The price returned back down, but the 200 SMA seems to be holding again.
The price has been trading around it since yesterday, but Gold is not deciding yet whether it wants to bounce higher or finally make a break to the downside. Traders are waiting to see whether Donald Trump pulls off September’s tariffs on China. If yes, then the break will likely come; if not, then range trading will continue and Gold will bounce off the 200 MA again. So, keep Trump’s twitter account on your screen, guys.
- Check out our free forex signals
- Follow the top economic events on FX Leaders economic calendar
- Trade better, discover more Forex Trading Strategies
- Open a FREE Trading Account
- Read our latest reviews on: Avatrade, Exness, HFM and XM
Related Articles


Sidebar rates
Related Posts
