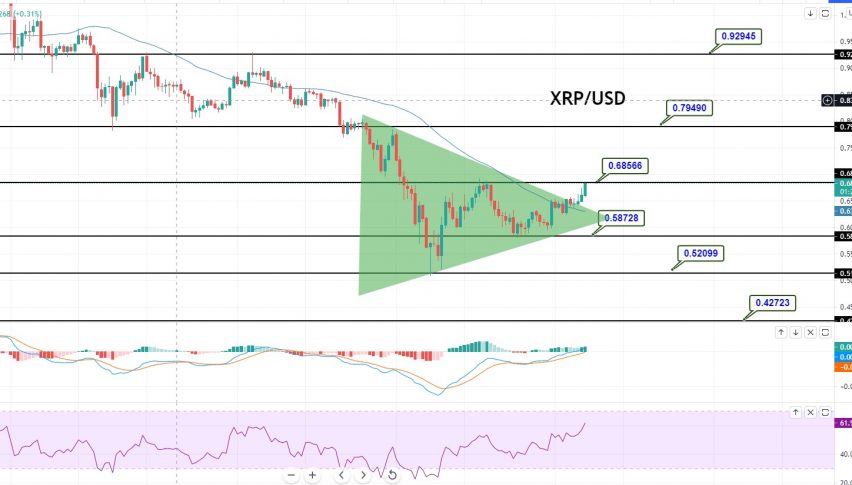
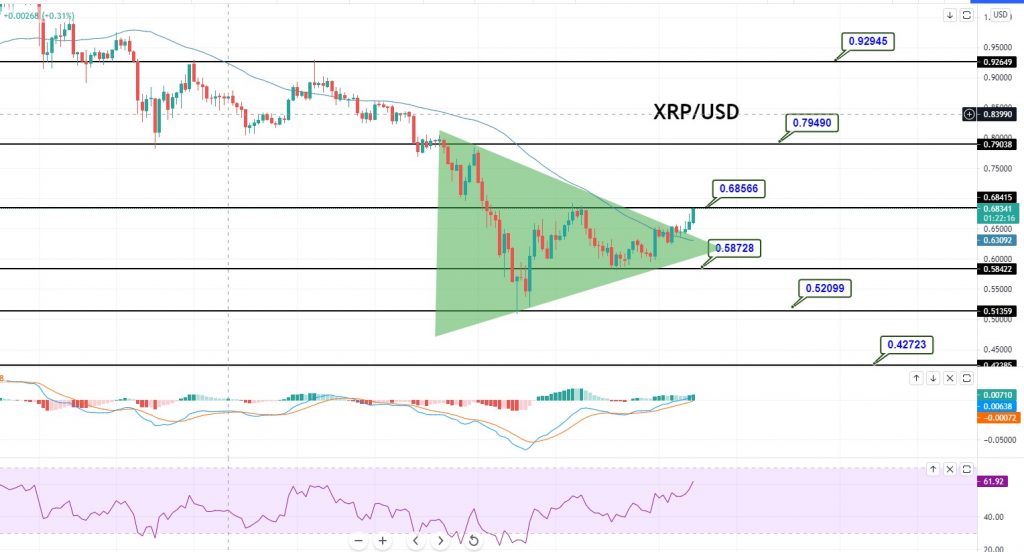
XRP/USD Violates Symmetrical Triangle Pattern – Brace for a Buying Trade!
On the technical side, the XRP/USD pair is trading with a bullish bias at 0.6825 level, facing immediate resistance at 0.6856 level...
During Tuesday’s early European trading session, the XRP/USD coin price succeeded in stopping the previous session’s declining streak, creeping higher to well above the $0.661590 level. The XRP/USD price is currently trading at $0.661590, with a 24-hour trading volume of USD 2,371,449,205. XRP went up 3.20% in the past 24 hours. Moving on, the XRP price may continue to trade within the narrow range, but if the seller is out of breath below the 9-day and 21-day moving averages, a bullish bias is expected. However, traders should keep an eye on the $0.85 before printing a new high at the resistance levels of $1.00, $1.10, and $1.15. Nevertheless, the XRP seller dictates the pace for the long-term but remains within the range on the short-term outlook.
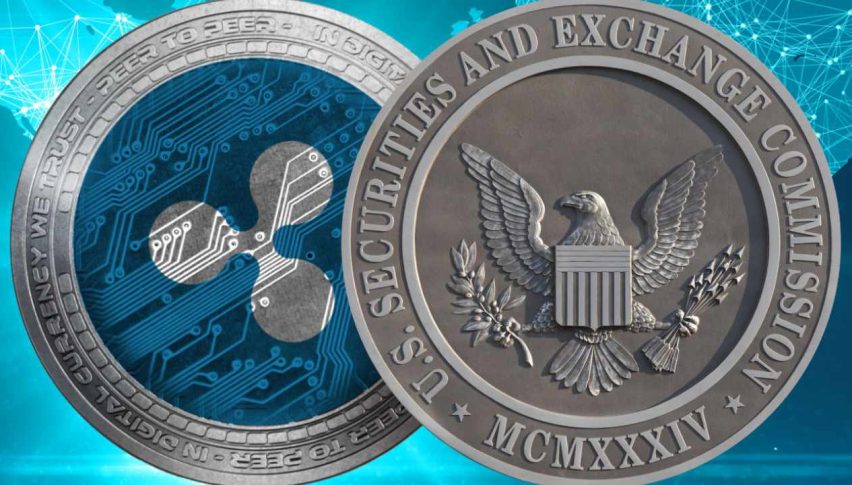
However, the bulls seem cautious about placing any strong positions, as the ongoing lawsuit between Ripple Labs and the US Securities and Exchange Commission, or SEC, continues, with the regulatory body claiming that XRP token holders are targeting its members on social media platforms with allegedly false statements. On the USD front, the broad-based US dollar succeeded in extending its early-day bullish run-up, remaining well bid during the early European session. The safe-haven demand supported the broad-based US dollar, as the more deadly Delta strain of the novel coronavirus spread in Asia and elsewhere, triggering fears of further lockdowns.
Moreover, the upticks in the dollar were further bolstered after the US Labor Department revealed that they are expected to report a gain of 690,000 jobs in June, compared with 559,000 in May, and an unemployment rate of 5.7%, against 5.8% in the past month. However, the gains in the US dollar were seen as one of the key factors that kept the XRP/USD pair lower.
Moving on, the traders are keeping their eyes on US consumer confidence data, which is due for release on the day. The Institute for Supply Management’s manufacturing index will also be key to watch for clues as to where interest rates are headed.
XRP/USD – Technical Outlook
On the technical side, the XRP/USD pair is trading with a bullish bias at 0.6825, and facing immediate resistance at 0.6856. A bullish breakout at 0.6856 has the potential to lead the XRP/USD price towards the 0.7949 level, while the support continues to hold around 0.5872.
On the 4-hour timeframe, the XRP/USD pair has violated the symmetrical triangle pattern, and this is likely to extend the buying trend in the coin. However, the double top pattern will be extending an immediate hurdle at the 0.6856 level. A breakout of this double top pattern could offer us an excellent buying opportunity until 0.7950. Good luck!
- Check out our free forex signals
- Follow the top economic events on FX Leaders economic calendar
- Trade better, discover more Forex Trading Strategies
- Open a FREE Trading Account
- Read our latest reviews on: Avatrade, Exness, HFM and XM
Related Articles
Sidebar rates
Related Posts
