Ripple (XRP) Eyes Breakout: Key Pivot at $0.63106 Signals Potential Surge
Ripple (XRP/USD) has seen a notable rise in its value, registering a 1.72% increase over the last 24 hours to reach a price point of $0.6268
Ripple (XRP/USD) has seen a notable rise in its value, registering a 1.72% increase over the last 24 hours to reach a price point of $0.626845. This uptick in value has propelled the cryptocurrency to a market capitalization of approximately $34.4 billion, securing its position as the sixth largest by market cap in the digital currency space. With a significant trading volume of over $1.2 billion in the same period, XRP showcases robust market activity.
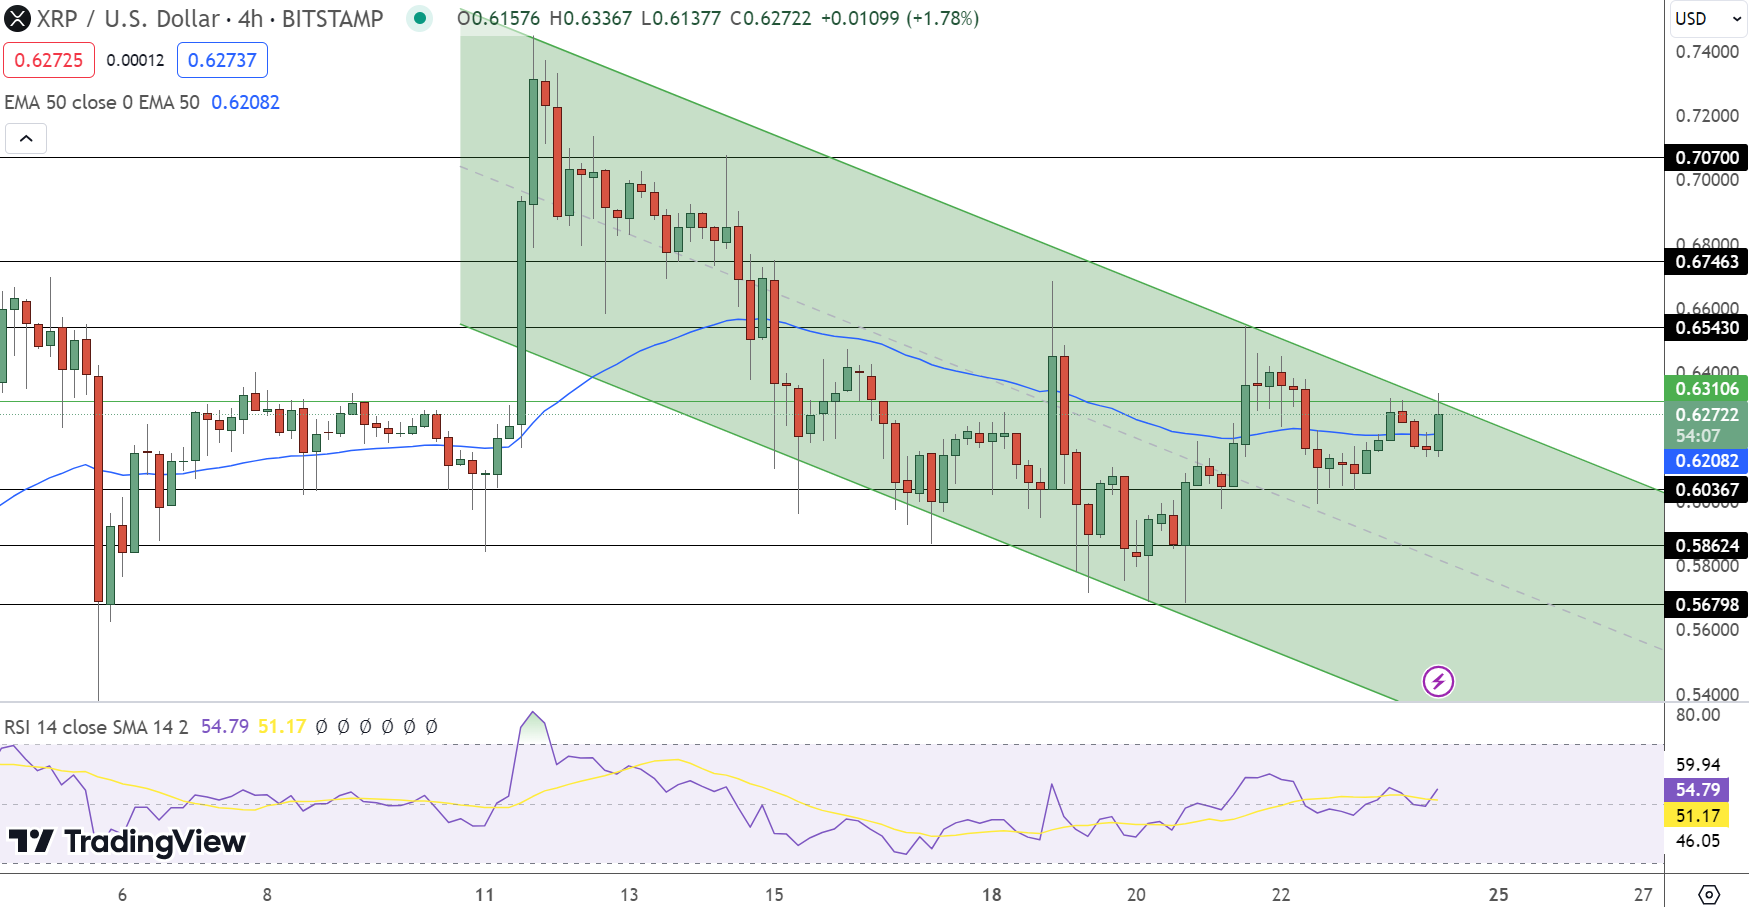
The technical landscape for Ripple presents a mix of bullish and bearish signals. The weekly pivot point stands at $0.63106, delineating a critical juncture for future price movements. Should XRP surpass this pivot level, it faces immediate resistance at $0.65430, with subsequent hurdles at $0.67463 and $0.70700. These resistance levels mark potential price targets in the event of continued upward momentum.
Conversely, if Ripple’s price fails to break above the pivot, immediate support lies at $0.60367. Additional support levels are found at $0.58624 and $0.56798, which could play a pivotal role in cushioning any downward pressure on the price.
The Relative Strength Index (RSI) reads at 54, suggesting a neutral to slightly bullish market sentiment. Furthermore, the 50-Day Exponential Moving Average (EMA) at $0.62082 corroborates the upward trend, providing a solid foundation for potential gains.
However, the presence of a downward channel on the daily timeframe poses challenges to Ripple’s ascent, indicating potential bearish undertones beneath the $0.6310 level. Yet, the alignment of the RSI and the 50 EMA towards bullish territory implies that a breakout above $0.6310 could ignite further positive price action.
In summary, Ripple’s current technical outlook suggests a cautiously optimistic trend, contingent upon overcoming the pivotal $0.63106 level. A successful breach could pave the way for notable gains, while failure to do so may trigger a reevaluation of support levels, ultimately shaping XRP’s trajectory in the forthcoming week.
- Check out our free forex signals
- Follow the top economic events on FX Leaders economic calendar
- Trade better, discover more Forex Trading Strategies
- Open a FREE Trading Account
- Read our latest reviews on: Avatrade, Exness, HFM and XM
Related Articles


Sidebar rates
Related Posts
