USDCAD Tests the Bottom of Triangle After Soft Canada GDP
The USD to CAD rate continues to trade in a triangle and today's soft Canada GDP report didn't offer a breakout.
The USD to CAD rate continues to trade in a triangle and today’s soft Canada GDP report didn’t offer a breakout. However, the pair is testing the bottom of the triangle, which is represented by the 200 SMA on the chart below, after the softer US core PCE price index, which showed that inflation is slowing in the US as well.
Despite some disappointing GDP data from Canada, the USD/CAD pair traded lower, but it encountered support around the 1.3620 zone. Buyers entered the market at this support level, leading to a rebound in the price, but it has returned back down here again at the end of the day. Looking ahead, the next resistance level to watch is the 100-bar moving average on the 4-hour chart, which is currently positioned at 1.3660.
USD/CAD Chart H4 – Can the 200 SMA Hold for Long?
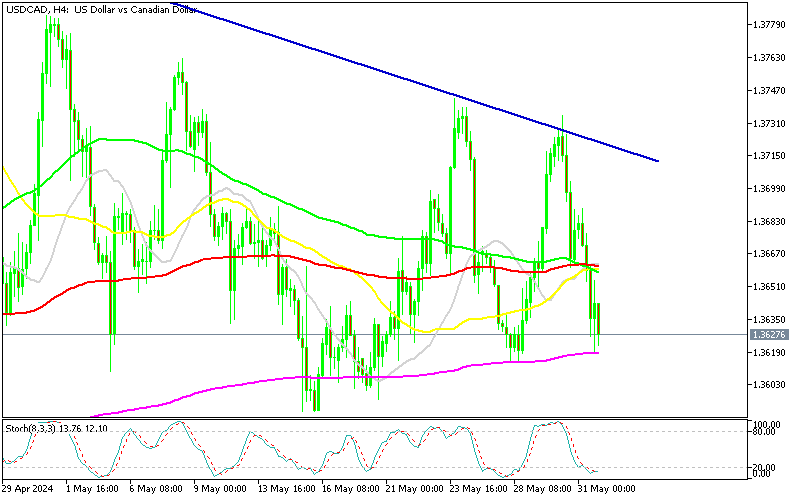
This moving average acted as a barrier during the previous session’s decline. If the price manages to surpass this level, the next target would be the 200-bar moving average on the 4-hour chart, located at 1.3660s. It’s worth noting that earlier today, the price encountered resistance near this moving average, attracting sellers. If the 200 SMA gets broken though, then the road will be open for 1.35.
Canada’s Q1 GDP Report
Key Metrics:
- Annualized GDP Q1: 1.7% (versus 2.2% estimate, prior quarter 1.0%)
- Quarter-over-Quarter GDP Q1 (annualized): 1.7% (versus 2.2% estimate)
- GDP Implicit Price Index: -0.3% (versus 1.4% estimate)
- GDP Year-over-Year Q1: 0.9% (versus 0.93% estimate)
- GDP Month-over-Month March: 0.0% (in line with the estimate, prior month 0.2%)
Analysis:
- Annualized Growth:
- Actual vs. Expected: The annualized GDP growth for Q1 came in at 1.7%, significantly below the 2.2% expected by analysts. However, this is an improvement from the 1.0% growth seen in the previous quarter.
- Quarter-over-Quarter Growth:
- Comparison: The QoQ annualized growth also missed expectations (1.7% vs. 2.2%). This suggests that the Canadian economy is growing, but not as robustly as anticipated.
- Implicit Price Index:
- Deflationary Signal: The GDP implicit price index showed a decline of 0.3%, compared to the expected increase of 1.4%. This indicates a deflationary trend, suggesting lower prices for goods and services produced in Canada during Q1.
- Year-over-Year Growth:
- Close to Estimates: The YoY growth rate was slightly below estimates at 0.9% compared to the expected 0.93%. This reflects a modest growth over the past year.
- Monthly Growth:
- Flat Growth in March: The GDP growth for March was flat at 0.0%, consistent with expectations, following a 0.2% growth in the prior month. This indicates a pause in economic activity towards the end of the quarter.
USD/CAD Live Chart
- Check out our free forex signals
- Follow the top economic events on FX Leaders economic calendar
- Trade better, discover more Forex Trading Strategies
- Open a FREE Trading Account
- Read our latest reviews on: Avatrade, Exness, HFM and XM
Related Articles


Sidebar rates
Related Posts
Ava

