Oil Prices Retreat Below $70 After the Large EIA Inventory Draw
Crude Oil jumped $2 higher yesterday to climb above $70 but has pulled back lower losing $1 today despite the large EIA crude inventory draw

Crude Oil jumped $2 higher yesterday to climb above $70, but has pulled back lower, losing $1 today, despite the large EIA crude inventory drawdown.

Oil prices have been struggling to maintain levels above $70, despite various factors influencing the market. Last week, crude briefly climbed past $71 but WTI crude quickly fell back below $70 after the ceasefire between Israel and Lebanon diminished the geopolitical risk premium. This drop erased a 3% gain, reflecting the market’s bearish sentiment. Even with significant inventory drawdowns reported by the EIA, buyers have failed to sustain gains above the $70 level.
EIA Weekly Crude Oil Inventory Data: Key Points
-
Crude Oil Inventories:
- Declined by -5,073K barrels, significantly surpassing the expected -671K.
- This marks a sharp contrast to the prior week’s decline of -1,844K barrels.
-
Gasoline Inventories:
- Increased by +2,362K barrels, significantly exceeding expectations of +639K barrels.
- Indicates a potential build-up in supply as consumer demand may be softening.
-
Distillate Inventories:
- Rose by +3,383K barrels, far outpacing the forecast of +940K barrels.
- Suggests a possible oversupply in heating oil or diesel fuel markets.
-
Refinery Utilization:
- Increased by +2.8%, much higher than the expected rise of +0.5%.
- Reflects increased refinery output, possibly in anticipation of seasonal demand shifts.
API Private Crude Oil Inventory Data from Yesterday
- Crude Oil: An unexpected increase of +1,232K barrels, contrasting with the official EIA drawdown.
- Gasoline: A significant build of +4,623K barrels, reinforcing the larger-than-expected EIA report.
- Distillates: Rose by +1,014K barrels, indicating consistent trends between private and official data.
The large drawdown in crude inventories signals tightening supply, which could support prices in the near term. However, the substantial builds in gasoline and distillates inventories indicate weaker demand or increased production, offsetting crude supply concerns. The refinery utilization jump suggests robust processing activity, possibly preparing for a spike in fuel consumption.
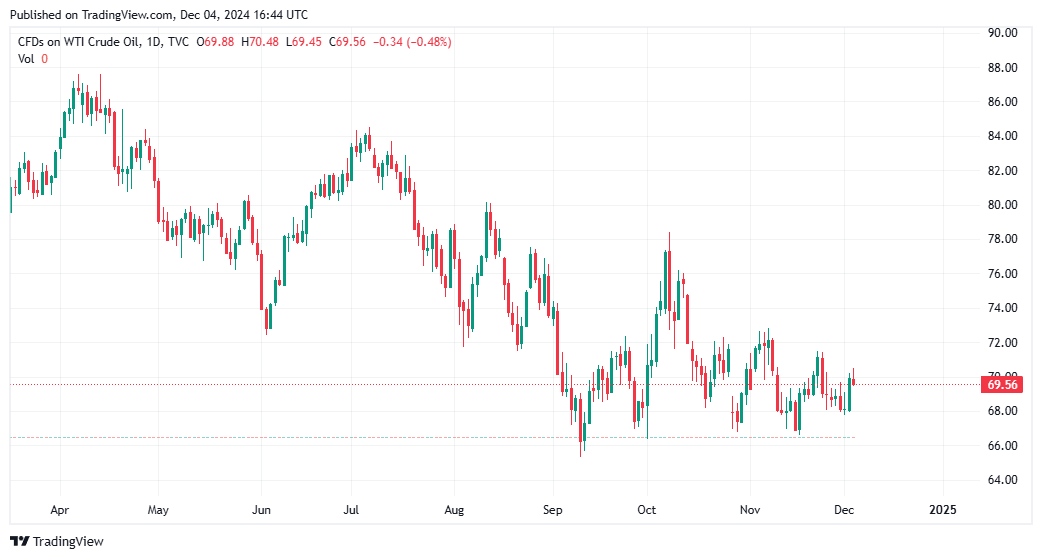
Crude Oil Chart Daily – The Downtrend Persists
While crude oil inventories dropped significantly, signaling tighter supply, the unexpected builds in gasoline and distillates inventories suggest demand may not be keeping pace with production. This divergence highlights a mixed outlook for energy markets, with bullish sentiment for crude prices potentially tempered by bearish signals in refined product markets.
The bearish trend persists, and oil remains locked in a range, with upward momentum unable to gain traction. OPEC+ discussions about delaying production normalization by three to six months have not provided sufficient support to drive prices higher.
WTI Crude Oil Chart Daily – Back in the Range
Adding to market uncertainty, President-elect Donald Trump’s strong statements on Middle East policy and potential conflict if Hamas does not release Israeli hostages have further heightened tensions. A resolution to geopolitical concerns may remove another risk premium, but for now, crude oil remains under pressure, with traders cautious about its ability to hold above $70
WTI Oil Live Chart
- Check out our free forex signals
- Follow the top economic events on FX Leaders economic calendar
- Trade better, discover more Forex Trading Strategies
- Open a FREE Trading Account
- Read our latest reviews on: Avatrade, Exness, HFM and XM
Related Articles


Sidebar rates
Related Posts
