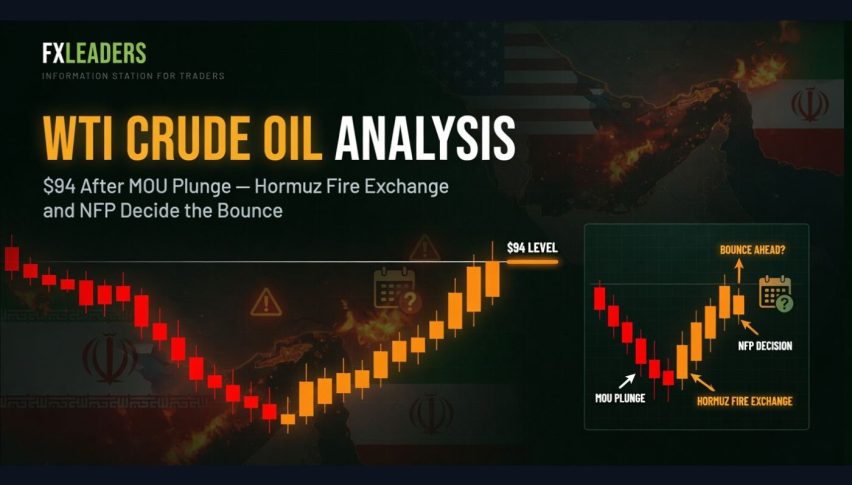
WTI Crude Oil Analysis: $94 After MOU Plunge — Hormuz Fire Exchange and NFP Decide the Bounce
WTI crude closed at $94.22 on May 8, down 1.27%, after dropping below $100 for the first time in six days. This followed reports...
Quick overview
- WTI crude closed at $94.22 on May 8, marking a 1.27% decline after dropping below $100 for the first time in six days.
- The decline followed reports of a preliminary MOU between the US and Iran to gradually reopen the Strait of Hormuz, which erased a significant risk premium in the market.
- Oil prices rebounded slightly after an exchange of fire between the US and Iran, but uncertainty remains regarding the impact of the MOU on future supply.
- Goldman Sachs estimates a 1.7 million barrel per day reduction in global demand this quarter, while the medium-term supply outlook is shifting towards gradual rebalancing.
WTI crude closed at $94.22 on May 8, down 1.27%, after dropping below $100 for the first time in six days. This followed reports from Saudi media and Axios that the US and Iran reached a preliminary MOU to gradually reopen the Strait of Hormuz. The drop from over $102 was the biggest single-day decline since March. On Thursday, the US and Iran exchanged fire in the strait. Trump called it a “love tap.” The market remains uncertain about how to interpret these events.
The MOU That Moved Oil $8 and Thursday’s Fire Exchange That Partially Reversed It
WTI dropped 6.3% to $96.21 on May 6, marking its largest single-day decline since March 17. This came after Saudi media outlets Alhadath and Al Arabiya reported that the US and Iran agreed to gradually reopen the Strait of Hormuz in exchange for easing the US naval blockade. The move erased the risk premium built up over the past three weeks in just one session.
Oil prices rebounded on Friday after the US and Iran exchanged fire in the Strait of Hormuz. WTI rose 0.88% to $95.64 as both Washington and Tehran blamed each other for starting the attack. Trump told ABC News that the ceasefire is still in effect and described the strikes as a “love tap.”
The market is now factoring in a key structural problem: even if the strait reopens tomorrow, Chevron CEO Mike Wirth said normalisation will take months. Mines need to be cleared from the sea, hundreds of stranded ships must leave the Gulf, and insurers need to feel confident enough to cover tankers crossing the strait again. The IEA confirmed that the war is disrupting about 14 million barrels per day of global supply and warned that any recovery in production after the conflict will be gradual.
Two structural changes are shifting the medium-term supply outlook. The UAE officially left the OPEC+ alliance on May 1, and OPEC+ announced a production increase of 188,000 barrels per day for June. This signals that oil-producing countries outside the conflict zone are preparing for normalisation, even though the timing is still uncertain due to ongoing shipping disruptions. Goldman Sachs estimates that high oil prices have already reduced global demand by 1.7 million barrels per day this quarter, and they have lowered their full-year 2026 demand growth forecast. Goldman’s baseline WTI forecast for Q4 2026 is $83.
WTI Technical Analysis: $90.56 Support Is the Key Level
The 4-hour chart shows WTI forming a shooting star rejection at the $98.57 upper channel boundary, with the pullback now testing the channel midline near $94.22. The oscillator has cooled from overbought toward neutral 38–41, showing mild positive divergence on the current dip.
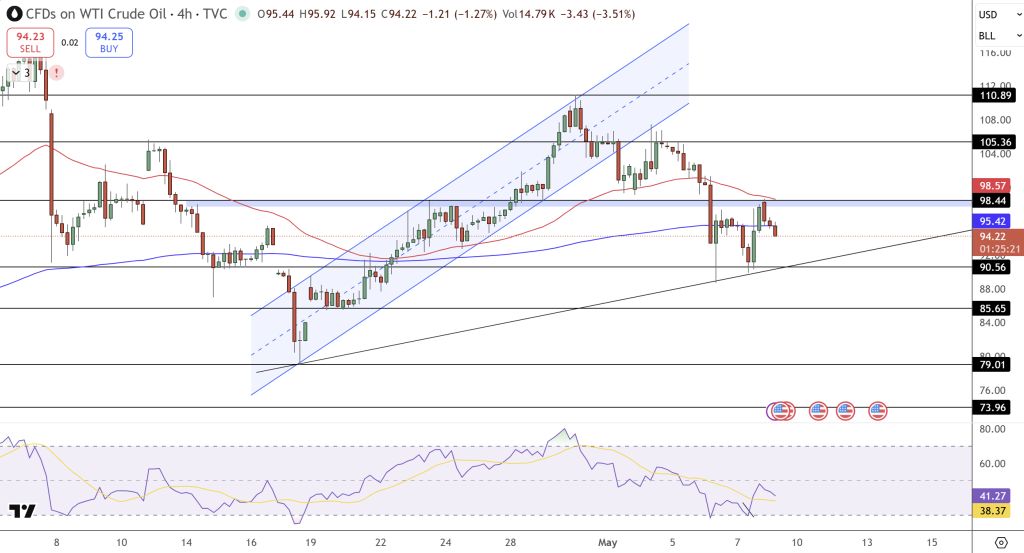
Resistance: $95.42 (red MA) → $98.57 (upper channel / 0.0 Fibonacci).
Support: $90.56 (0.382–0.5 Fibonacci) → $85.65 (April swing low / channel base).
The upward channel that started from the April lows is still intact as long as $90.56 holds. If there is a confirmed bounce from the $92 to $93.50 area, it could lead to a recovery toward $98.57.
Trade setup: Go long if there is a bounce between $93.50 and $92, with a target of $98.57 and a stop below $90.56.
NFP outlook for May 8: If April’s jobs number is soft (consensus is 62,000), it could ease fears of rate cuts, weaken the dollar, and support a WTI recovery toward $96 to $98. If the number is much stronger, it would reinforce concerns about falling demand—Goldman’s estimate of a 1.7 million barrel per day demand reduction is already in play—and could lead to a deeper test of $90.56.
FAQ: WTI, MOU Impact, OPEC+ June Increase, and the $83 Q4 Target
Why did WTI fall below $100 on the MOU news?
The MOU marked the first structured diplomatic plan for reopening the Strait of Hormuz, which led to the largest single-day WTI decline since March 17. The market had been expecting a long disruption of 14 million barrels per day, but once a credible reopening timeline appeared, the risk premium dropped quickly. The partial recovery after Thursday’s exchange of fire in Hormuz shows the market is still unsure if the MOU will actually lead to a peace agreement.
What does the UAE’s OPEC+ exit and the June production increase mean for WTI?
The UAE left OPEC+ on May 1, and OPEC+ announced an extra 188,000 barrels per day of production for June. This sends a strong supply signal from producers. However, immediate implementation is limited by ongoing shipping disruptions in Hormuz. It shows that Gulf producers expect normalisation and are preparing for it. Along with Goldman’s estimate of a 1.7 million barrel per day drop in demand, the medium-term supply and demand balance is moving from a severe shortage toward gradual rebalancing.
What is the WTI price target for Q4 2026?
Goldman Sachs keeps its Q4 2026 WTI baseline at $83, with a chance for higher prices if normalisation in Hormuz is delayed. The EIA expects Brent to average $88 in Q4 2026, assuming traffic through the Strait slowly resumes but does not reach pre-conflict levels until late 2026. If there is a breakout above $98.57, the near-term technical target is $105. If Iran fully accepts the MOU, the risk premium could quickly drop, bringing prices down to the $85 to $88 range within weeks.
- Check out our free forex signals
- Follow the top economic events on FX Leaders economic calendar
- Trade better, discover more Forex Trading Strategies
- Open a FREE Trading Account
- Read our latest reviews on: Avatrade, Exness, HFM and XM
Related Articles


Sidebar rates
Related Posts
