META stock is currently in a correction phase after being rejected at the critical Golden Ratio resistance near $701.
Immediate support is found between $581 and $600, with a potential decline toward $525 if this level fails.
A breakout above $701 could lead to a bullish advance towards the all-time high of $796.25.
Momentum indicators are mixed to bearish, highlighting the importance of key technical levels for future price direction.
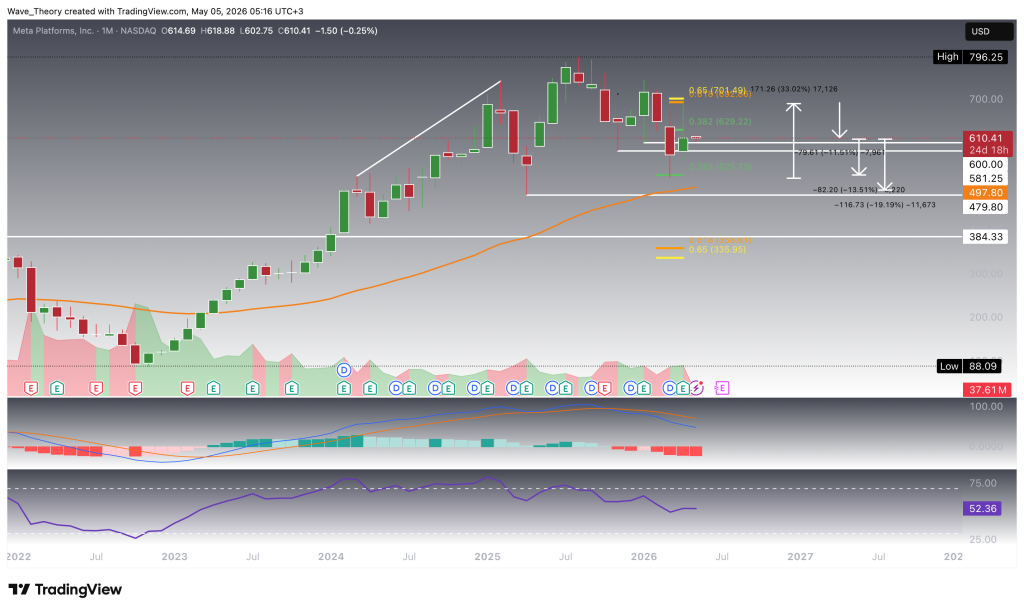
Meta stock entered a prolonged correction phase after peaking at its all-time high of $796, declining to the key 0.382 Fibonacci support level near $525. From that zone, shares staged a strong bullish reversal, rallying roughly 33% and signaling renewed upside momentum.
META Stock Tests Key Support as Correction Remains Intact Below $701
After rebounding sharply from the 0.382 Fibonacci support near $526 last month, META stock rallied approximately 33% and advanced into the critical Golden Ratio resistance zone at $701. However, price action was rejected at that level, triggering a pullback of roughly 11.5% toward the horizontal support region between $581 and $600. This zone previously acted as support last month and is now serving as the key near-term base as META attempts to retarget the next Fibonacci resistance levels at $629 and $701 during the current month.
From a structural perspective, the broader correction phase remains valid unless META decisively breaks above the Golden Ratio resistance at $701. A confirmed breakout through that level would materially improve the technical outlook, opening the door for a retest of the all-time high at $796 and potentially a continuation into new record territory.
Momentum indicators, however, still reflect a cautious tone. The MACD lines remain bearishly crossed, while the MACD histogram has been declining for four consecutive months, indicating fading upside momentum. Meanwhile, the RSI continues to trade in neutral territory, offering no strong directional signal at present.
On the downside, a failure to hold the current support zone between $581 and $600 could expose META to another leg lower. In that scenario, shares could decline approximately 13.5% toward the 0.382 Fibonacci support at $525, or extend losses by roughly 19.2% to test the 50-month EMA near $498.
META
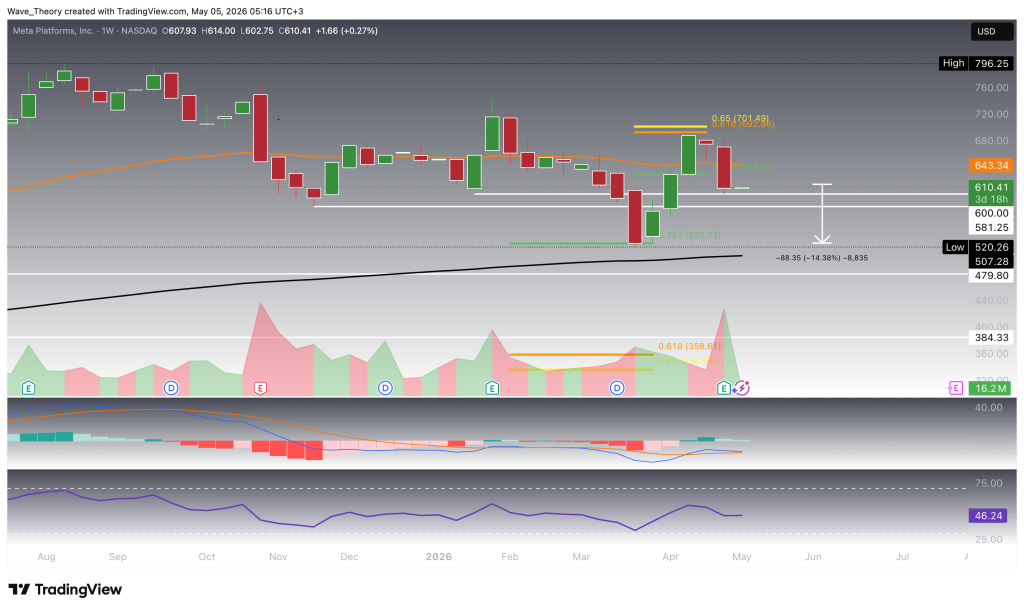
Harsh Rejection at Golden Ratio Resistance Signals Risk of Further Downside
META stock faced a sharp rejection at the critical Golden Ratio resistance near $701 two weeks ago, triggering a notable sell-off and increasing the probability of a continued downside move. From current levels, this corrective leg could extend by approximately 14.4%, with the next major technical support located at the 200-week EMA near $507.
Despite the recent weakness, the medium-term trend structure remains constructive. The weekly EMAs continue to display a bullish golden crossover, which supports the broader uptrend and suggests that the prevailing trend has not yet fully reversed.
Momentum indicators, however, are beginning to deteriorate. The MACD lines are on the verge of a bearish crossover, while the MACD histogram has been ticking lower since last week, signaling fading bullish momentum. Meanwhile, the RSI remains in neutral territory, reflecting the absence of an extreme momentum condition and leaving room for further directional movement in either direction.
META
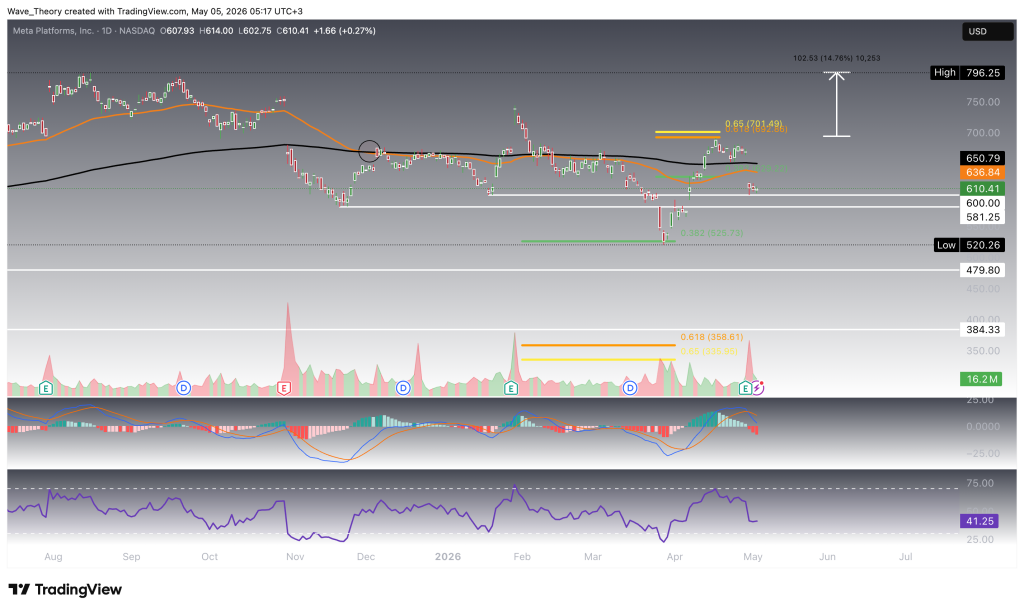
Bullish Breakout Above $701 Could Trigger 15% Upside Toward Record Highs
Should META stock break out decisively above the critical Golden Ratio resistance at $701, it would invalidate the immediate corrective structure and open the path for a bullish advance of roughly 15% toward its all-time high at $796.25. A sustained move through this resistance zone would likely reestablish upside momentum and place META back within reach of record territory.
Despite this bullish breakout scenario, current daily indicators continue to reflect a predominantly bearish short-term setup. The EMAs have formed a death cross, confirming the trend bearishly in the short- to medium-term horizon. In addition, the MACD lines remain bearishly crossed, while the MACD histogram has been ticking lower for several consecutive sessions, signaling persistent downside momentum.
At the same time, the RSI remains in neutral territory and is not providing a clear bullish or bearish directional signal, suggesting that price action around the $701 resistance level will likely determine the next major move.
META
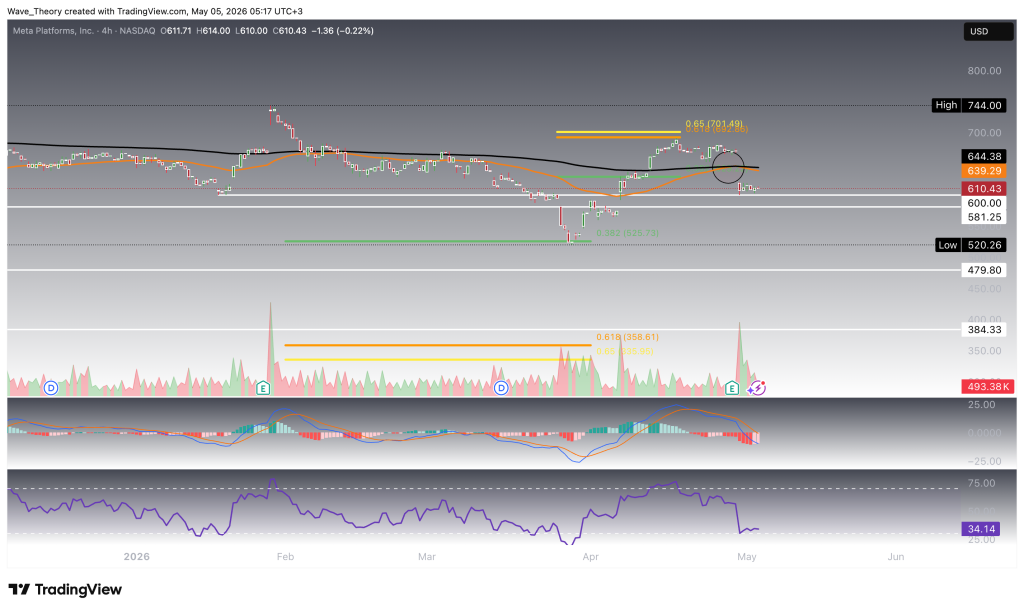
Death Cross Emerges on 4H Chart as META Trades Between Key Support and Resistance
On the 4-hour chart, META stock has also formed a death cross, with the shorter-term EMAs crossing below the longer-term EMAs. This confirms a bearish short-term trend structure and reflects weakening momentum across lower time frames.
Additional momentum indicators remain cautious. The MACD lines are bearishly crossed, while the RSI continues to trade in neutral territory, offering no decisive directional signal. However, the MACD histogram has begun to tick higher, indicating that bearish momentum may be fading and that an early stabilization attempt could be developing.
For now, META remains range-bound between the key support zone at $581–$600 and the major resistance level at $701. A decisive break of either boundary is likely to determine the next directional trajectory, with support failure favoring renewed downside pressure and a breakout above resistance signaling a stronger bullish recovery phase.
META
META Stock Summary: Key Levels to Watch
META remains in a corrective phase after being rejected at the critical Golden Ratio resistance near $701. As long as price trades below this level, downside pressure remains elevated. Immediate support is located between $581 and $600, a decisive zone that currently determines short-term direction. If this range breaks, META could decline toward the next major Fibonacci support at $525, followed by the 200-week EMA near $507 and the 50-month EMA near $498.
On the upside, a confirmed breakout above $701 would invalidate the ongoing correction structure and likely trigger a bullish continuation toward the all-time high at $796.25. Momentum indicators across multiple timeframes remain mixed to bearish, making these technical levels especially important for META’s next major move.
Konstantin Kaiser comes from a data science background and has significant experience in quantitative trading. His interest in technology took a notable turn in 2013 when he discovered Bitcoin and was instantly intrigued by the potential of this disruptive technology.