Roblox stock has declined over 72% from its all-time high, raising concerns about the potential for further downside.
Technical indicators show a bearish trend, with the stock facing significant resistance levels at $52.80, $57.50, and $67.00.
Roblox is approaching a critical support zone between $21.65 and $28.50, where a potential recovery could occur.
A breakout above $112 is necessary to shift the long-term outlook to bullish and target previous highs.
Roblox stock has suffered a steep decline, plunging roughly 72% from its all-time high and leaving investors questioning whether the worst of the downtrend is finally over. With shares now trading near critical technical levels, the key question is whether Roblox is preparing for a sustainable recovery—or if further downside still lies ahead.
Roblox Corporation Stock Suffers Major Technical Breakdown
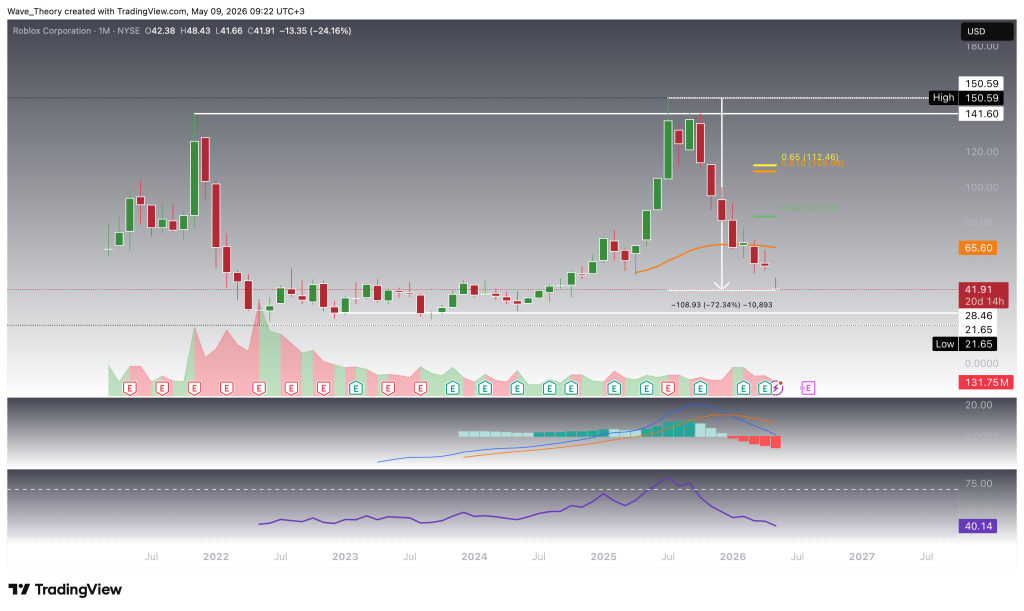
Over the past eight months, Roblox Corporation stock has endured a severe correction, declining by more than 72% and reflecting substantial downside pressure across the broader trend structure. The magnitude of the sell-off has pushed shares into a technically weakened position, with momentum indicators continuing to favor the bears.
The MACD lines have crossed bearishly, while the MACD histogram has been ticking lower for several consecutive months, signaling persistent negative momentum and the absence of a confirmed reversal phase. Meanwhile, the RSI continues to trade in neutral territory, indicating that Roblox is neither deeply oversold nor showing a strong bullish momentum signal at present.
From a price structure perspective, Roblox now approaches its next significant support zone between $21.65 and $28.50, an area where buyers could re-emerge and trigger a bullish rebound attempt. On the upside, the first major long-term resistance remains the 50-month EMA near $65.60, which would likely act as a substantial barrier in any broader recovery scenario.
Roblox
Potential Death Cross on Weekly Chart Signals Mid-Term Risk for Roblox Stock
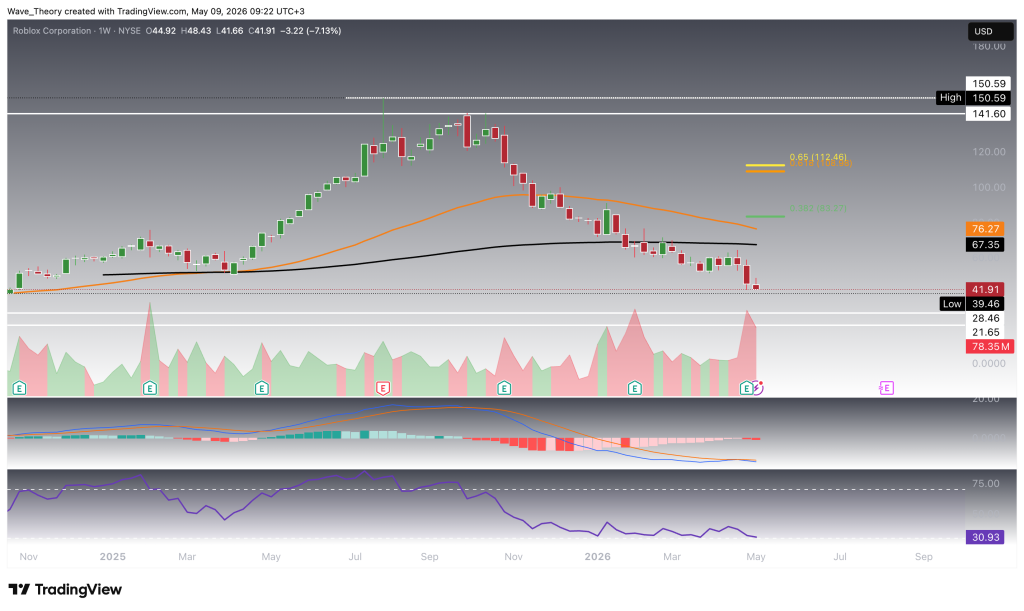
On the weekly chart, Roblox stock is at risk of forming a death cross, as the shorter-term EMAs are approaching a bearish crossover beneath the longer-term EMAs. If confirmed, this would reinforce a bearish mid-term trend structure and signal continued technical weakness.
Momentum indicators already reflect a cautious outlook. The MACD lines have crossed bearishly, while the MACD histogram has been ticking lower since last week, indicating building downside momentum. At the same time, the RSI remains in neutral territory, offering no clear bullish reversal signal for now.
Should Roblox initiate a recovery phase, the next major Fibonacci resistance levels are located at $83 and $112. The Golden Ratio resistance at $112 remains the key structural threshold. Only a decisive breakout above this level would invalidate the broader correction phase and materially improve the long-term outlook.
If Roblox successfully clears $112, the stock could target a return toward its all-time high at $150.60, with the potential to extend beyond previous records. Historical resistance is concentrated between $141.60 and $150.60, making this zone a critical upside target in any sustained bullish recovery scenario.
Roblox
Bearish Signals Dominate the Daily Chart as Roblox Tests Lower Levels
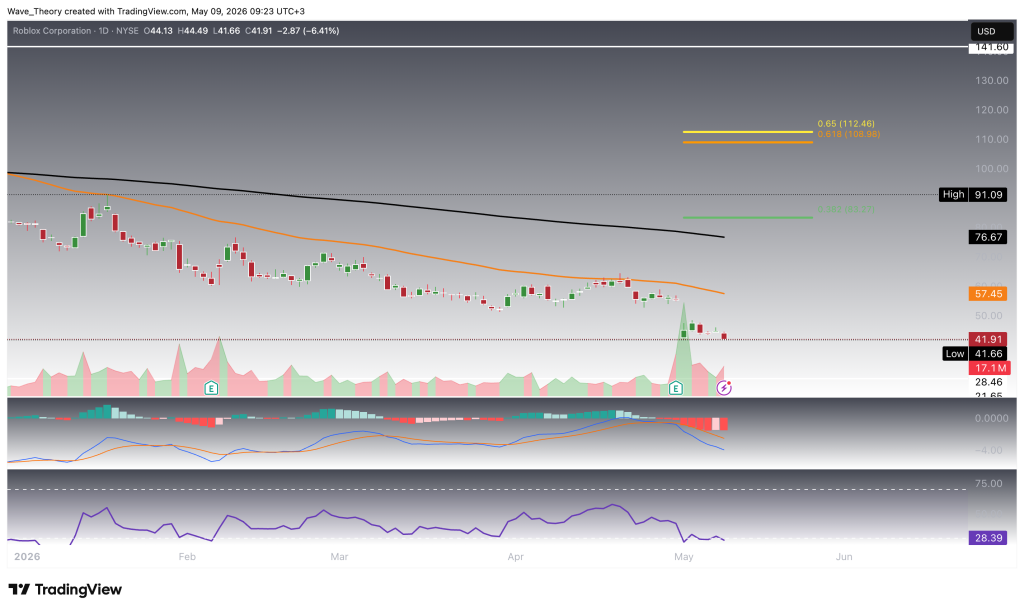
On the daily chart, Roblox Corporation has formed a death cross, with the shorter-term EMAs crossing below the longer-term averages. This confirms a bearish trend structure across the short- to medium-term horizon and reflects continued downside pressure in recent price action.
Additional momentum indicators remain negative. The MACD lines are bearishly crossed, while the MACD histogram continues to tick lower, signaling sustained bearish momentum. At the same time, the RSI is approaching oversold territory, suggesting that selling pressure may be becoming stretched.
Recently, Roblox faced a bearish rejection at the 50-day EMA resistance near $57.50, reinforcing that level as an important near-term barrier. Following that rejection, the stock could now move toward setting a lower low if downside momentum persists.
That said, the RSI is beginning to show the potential for a bullish divergence. If confirmed, this could indicate fading downside momentum and potentially trigger a short-term recovery rally, capable of lifting Roblox shares higher in the near term.
Roblox
Roblox Faces Continued Downside Pressure on the 4H Chart
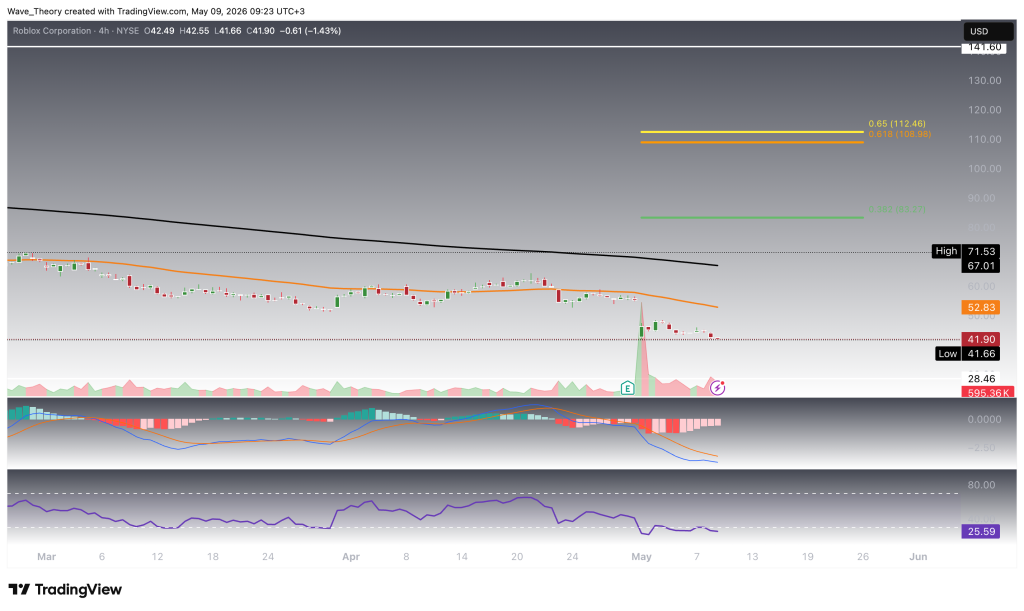
Roblox stock has been consistently rejected at the 50-period EMA on the 4-hour chart near $52.80, reinforcing this level as a key short-term resistance and highlighting the market’s inability to sustain bullish momentum. As long as price remains below this dynamic barrier, downside pressure is likely to persist.
Momentum indicators remain mixed but cautious. The MACD lines have crossed bearishly, signaling continued short-term weakness. However, in contrast to the bearish crossover, the MACD histogram has been ticking higher, which may indicate that negative momentum is beginning to fade and that a stabilization attempt could be forming.
At the same time, the RSI is approaching oversold territory, suggesting that the recent sell-off may be becoming stretched and increasing the probability of a short-term relief bounce.
For now, Roblox faces its next significant resistance levels at $52.80 and $67.00. A break above these levels would be required to materially improve the short-term technical outlook, while continued rejection could keep the stock under downward pressure.
Roblox
Roblox Stock Summary: Key Levels to Watch
Roblox stock remains under broad corrective pressure after suffering a decline of more than 72%, with bearish signals visible across the monthly, weekly, daily, and 4-hour charts. The trend remains weak as long as price continues to trade below the key near-term resistance levels at $52.80, $57.50, and the higher recovery barrier at $67.00.
On the downside, Roblox approaches an important long-term support zone between $21.65 and $28.50, where buyers could attempt to form a meaningful base. If a recovery develops, the next major Fibonacci resistance levels are located at $83 and $112. A decisive breakout above the Golden Ratio resistance at $112 would invalidate the broader correction phase and shift the long-term outlook bullishly.
Above $112, Roblox could target the historical resistance zone between $141.60 and $150.60, which includes the previous all-time high at $150.60. Until then, rallies may continue to face selling pressure within the broader downtrend.
Konstantin Kaiser comes from a data science background and has significant experience in quantitative trading. His interest in technology took a notable turn in 2013 when he discovered Bitcoin and was instantly intrigued by the potential of this disruptive technology.