Strategy Stock (MSTR) Down 81%: Could a Bitcoin Crash Trigger Liquidation?

Quick overview
- MicroStrategy, now known as Strategy (MSTR), has transformed into a highly leveraged Bitcoin proxy under the leadership of Michael Saylor.
- The company's aggressive strategy involves continuously acquiring Bitcoin, but its future hinges on Bitcoin's value stability.
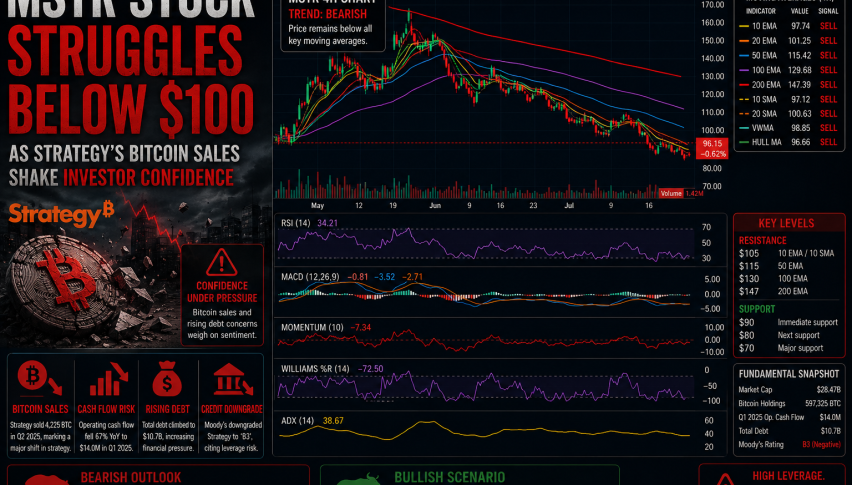
- Despite a significant 81% decline from its peak, the long-term trend remains bullish, with key support and resistance levels identified.
- Recent technical indicators suggest a potential short-term relief rally, but the bears currently maintain control of the stock.
MicroStrategy, now operating under the Strategy brand (MSTR), has become one of the most controversial stocks on Wall Street. What was once an enterprise software company has transformed into a highly leveraged Bitcoin proxy, with executive chairman Michael Saylor building the largest corporate Bitcoin treasury in history. The company’s strategy is simple but aggressive: continuously acquire more Bitcoin through a combination of operating cash flow, equity offerings, and debt issuance.
For investors, the liquidation debate ultimately comes down to one variable: Bitcoin. As long as Bitcoin maintains enough value to support Strategy’s balance sheet and financing model, the company can continue executing its acquisition strategy. But if Bitcoin were to experience a prolonged collapse far beyond previous bear markets, the question becomes whether Strategy remains a leveraged Bitcoin investment vehicle—or becomes one of the largest corporate casualties of the cryptocurrency cycle.
Strategy: Long-term Bitcoin holdings
Importantly, Strategy cannot be “liquidated” simply because Bitcoin falls. Most of its debt is long-dated, and the company does not face traditional margin calls on the majority of its Bitcoin holdings. However, a severe and sustained decline in Bitcoin could create pressure through multiple channels: shrinking collateral values, reduced access to capital markets, dilution from additional equity raises, and growing concerns about debt refinancing. In an extreme scenario, where Bitcoin remains depressed for years while capital markets close to new funding, Strategy could be forced to sell Bitcoin to meet obligations or refinance debt under unfavorable conditions.
Strategy Stock: Bearish Death Cross Threatens the Weekly Structure
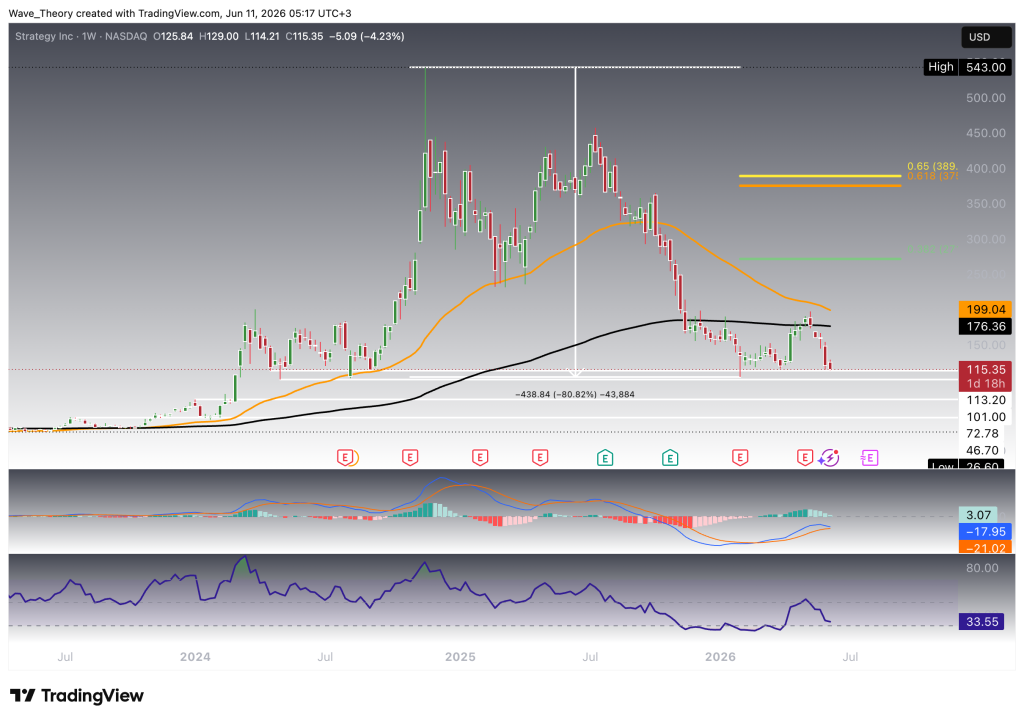
The weekly chart continues to deteriorate and could soon deliver another bearish signal. The EMAs are on track to form a death cross, which would confirm a bearish trend reversal on the mid-term timeframe. At the same time, the MACD lines are approaching a bearish crossover, while the MACD histogram has been printing lower readings for several consecutive weeks, reflecting weakening momentum.
The RSI is also approaching oversold territory. This development could become particularly important if Palantir falls below its previous low at $101. In that scenario, the RSI could form a bullish divergence, often an early indication that selling pressure is beginning to exhaust itself despite further price weakness.
Should the correction deepen, the next major support zone emerges between $46.70 and $73.00. This region represents a significant long-term support area and could attract substantial buying interest.
On the upside, Palantir faces major Fibonacci resistance levels near $272 and $380. The most important resistance remains the golden ratio level at approximately $390. Only a decisive breakout above this level would invalidate the ongoing correction and restore a fully bullish long-term outlook. Until then, the broader corrective phase remains firmly intact.
Death Cross Keeps Strategy Under Pressure on the Daily Chart
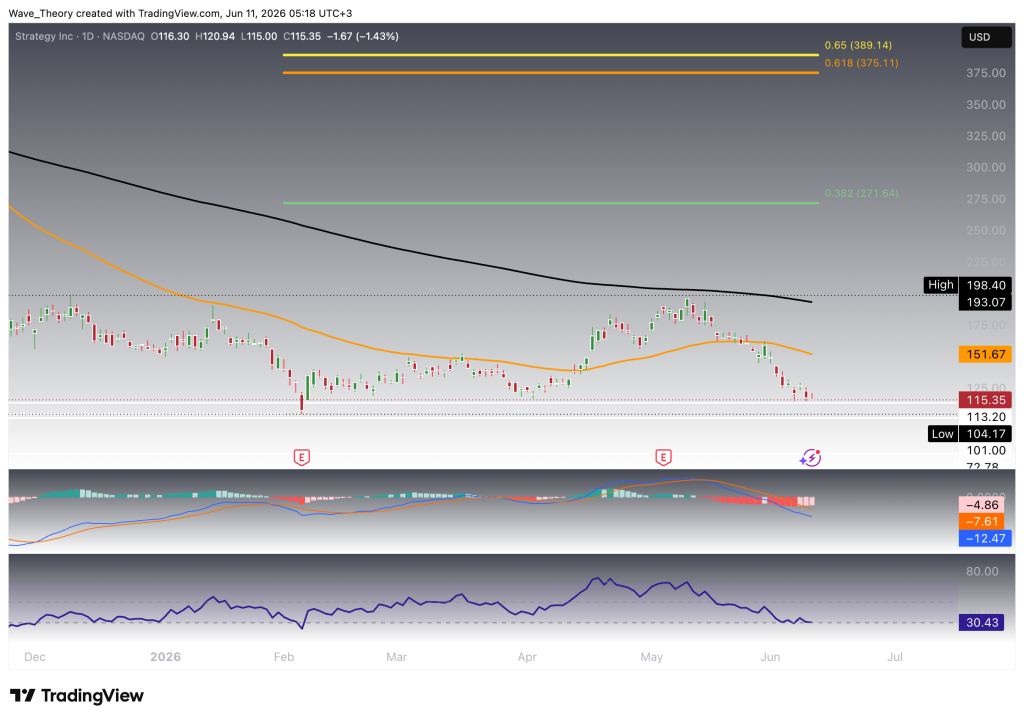
The daily chart continues to favor the bears. The EMAs have already formed a death cross, confirming a bearish trend across the short- to medium-term timeframe. This bearish structure remains intact as long as Strategy trades below key moving-average resistance levels.
Momentum indicators also paint a cautious picture. The MACD lines remain bearishly crossed, while the RSI is approaching oversold territory. However, there are early signs that downside momentum may be fading. The MACD histogram has been ticking higher for several consecutive days, suggesting that bearish momentum is weakening. At the same time, the RSI could potentially form a bullish divergence, which would strengthen the case for a relief rally.
Recently, Strategy failed to break above the 200-day EMA resistance near $193, reinforcing this level as a major barrier for the bulls. Should the stock continue its decline, the next important support zone sits between $101 and $113. This area could serve as a foundation for a bullish rebound and therefore remains the key support region to watch in the near term.
Strategy
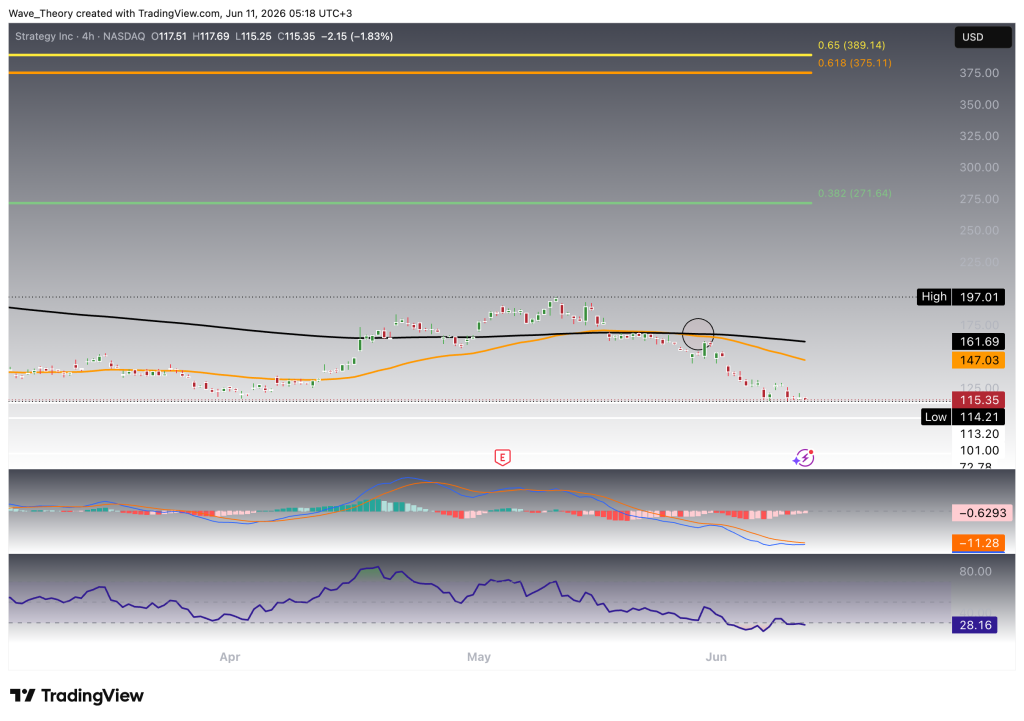
Recent Death Cross Emerges on the 4-Hour Chart
Strategy Stock (MSTR) Analysis Summary & Key Levels
Strategy (MSTR) remains under significant pressure after collapsing roughly 81% from its November 2024 peak. The stock continues to trade within a broad corrective structure, with bearish signals dominating the weekly, daily, and 4-hour timeframes. Both the daily and 4-hour charts have already established death crosses, while the weekly chart is on the verge of forming one. Meanwhile, the MACD remains bearish across most timeframes, although several early signs suggest downside momentum may be starting to fade.
The most important support zone sits between $101 and $113. A successful defense of this area could trigger a relief rally toward the 50-EMA and 200-EMA resistance zone between $147 and $161. Beyond that, the next major resistance levels are the 200-day EMA at $193, followed by the Fibonacci resistance zones near $272 and $380.
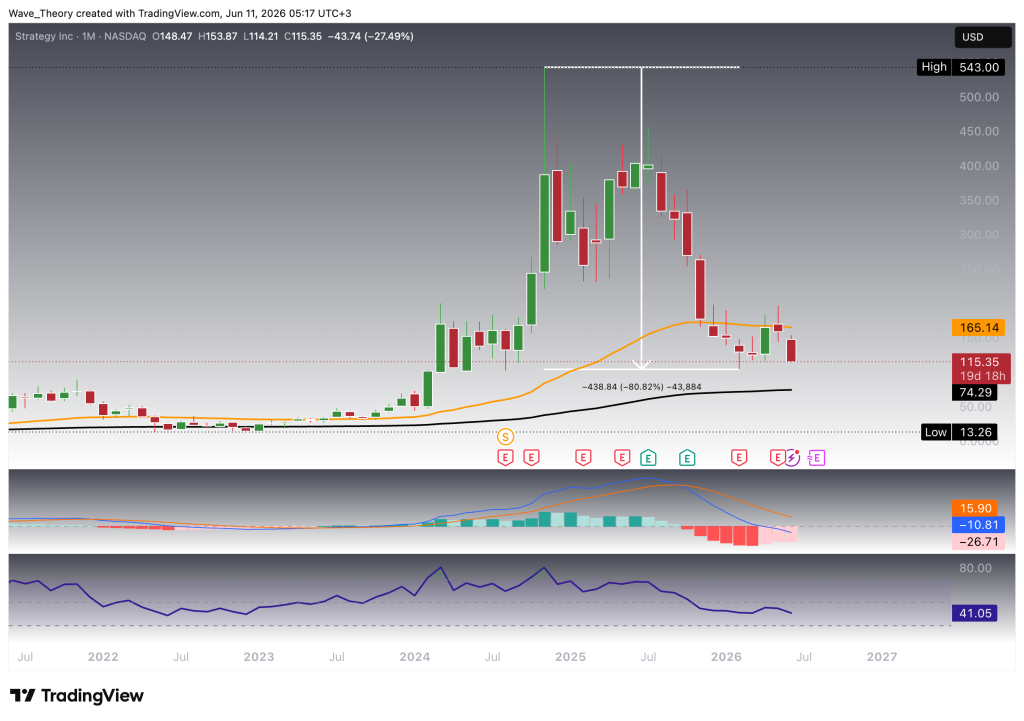
If the correction deepens and the $101 support fails, the next major downside target emerges at the 200-month EMA near $74.30. Additional long-term support lies between $46.70 and $73.00. These levels could become attractive accumulation zones should selling pressure intensify further.
Despite the severe correction, the monthly chart still maintains a bullish long-term structure. The EMAs continue to display a golden crossover, and the MACD histogram has been rising for three consecutive months. However, the broader correction remains intact until key resistance levels are reclaimed. The most important level on the upside remains the golden ratio resistance near $390. Only a decisive breakout above this level would invalidate the ongoing correction and restore a fully bullish long-term outlook.
For now, the bears retain control. However, improving momentum indicators and emerging bullish divergences suggest that a short-term bounce may be approaching. The battle between support at $101-$113 and resistance at $147-$161 will likely determine Strategy’s next major move.
- Check out our free forex signals
- Follow the top economic events on FX Leaders economic calendar
- Trade better, discover more Forex Trading Strategies
- Open a FREE Trading Account
- Read our latest reviews on: Avatrade, Exness, HFM and XM
Related Articles


Sidebar rates
Related Posts
Ava

