Netflix Stock (NFLX) Deepens Correction: Perfect Bull Entry Setup?

Quick overview
- Netflix has experienced a significant correction after reaching an all-time high, but remains a strong long-term performer in the tech sector.
- The stock is currently testing critical Golden Ratio support between $58.14 and $61.96, which is vital for maintaining its long-term bullish trend.
- Despite weakening momentum indicators, there are signs of potential stabilization and a possible relief rally as the stock holds above key support levels.
- The outlook remains mixed, with higher timeframes showing bullish signals while lower timeframes indicate ongoing bearish trends.
Netflix (NASDAQ: NFLX) remains one of the strongest long-term performers in the technology sector despite entering a meaningful correction after reaching a new all-time high. Supported by strong subscriber growth, expanding operating margins, increasing free cash flow, and continued investments in advertising and live content, Netflix has remained one of Wall Street’s favorite large-cap growth stocks.
After rallying more than 720% from its 2022 bear market low to a record high of $134.12, however, the stock has entered a corrective phase. The pullback has pushed Netflix directly toward one of the most important technical support regions on the chart: the Golden Ratio retracement between $58.14 and $61.96.
While the long-term trend remains constructive, momentum indicators across multiple timeframes have weakened considerably. Investors are now watching whether Netflix can stabilize around current support and resume its long-term uptrend or whether the correction will deepen before buyers regain control.
Fundamentally, Netflix is a premium Buffetology pick because it combines a durable competitive moat, highly predictable recurring subscription revenue, expanding operating margins, exceptional free cash flow generation, disciplined capital allocation, and consistent long-term earnings growth. After successfully transitioning from a cash-intensive growth phase to a highly profitable cash-generating business, Netflix now exhibits many of the characteristics Buffett values most: pricing power, customer loyalty, scalable economics, and the ability to compound shareholder value over decades.
Netflix Stock Nears Major Fibonacci Support on the Monthly Chart
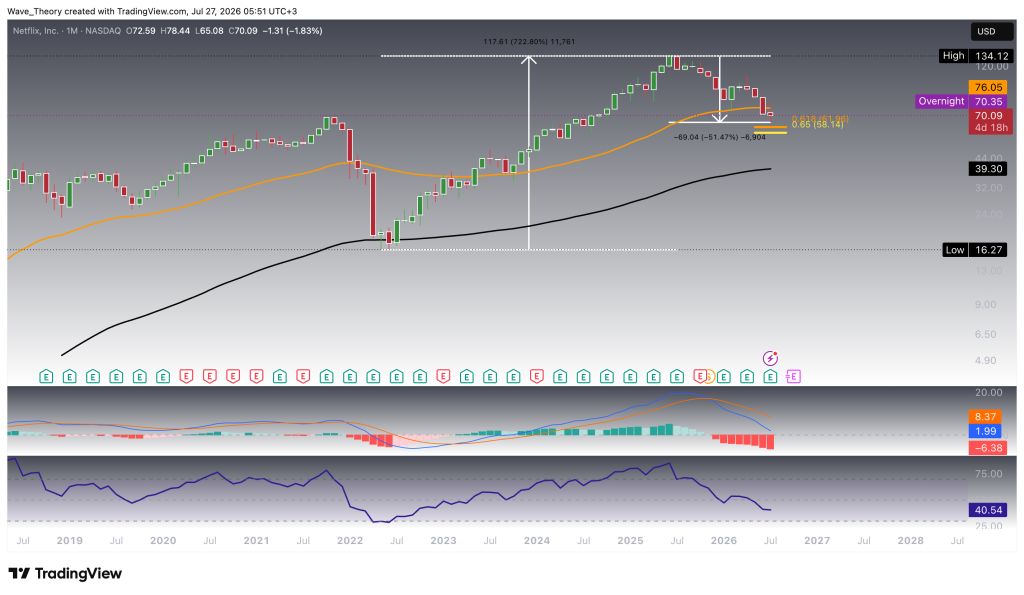
On the monthly chart, Netflix remains in a long-term bull market despite its recent correction. After surging more than 720% from the 2022 low to its new all-time high at $134.12, the stock has retraced roughly 51.5%, bringing price directly into the first major Fibonacci support zone.
The Golden Ratio support between $58.14 and $61.96 now represents the most important long-term support area. As long as Netflix continues holding above this region, the broader secular uptrend remains structurally intact. A sustained monthly close below the Golden Ratio would significantly weaken the long-term technical picture and could trigger a deeper correction.
For Netflix bulls, the price range between $58 to $62 could translate into the perfect entry point. However, momentum continues to deteriorate. The MACD lines remain bearishly crossed, and the MACD histogram has been ticking lower for several consecutive months, reflecting weakening bullish momentum. Meanwhile, the RSI has fallen back into neutral territory after previously reaching overbought conditions, suggesting the prior buying pressure has largely cooled.
The monthly EMAs continue displaying a golden crossover, confirming that the long-term trend remains bullish despite the ongoing correction.
Weekly Chart Shows Massive Bullish Divergence On The RSI
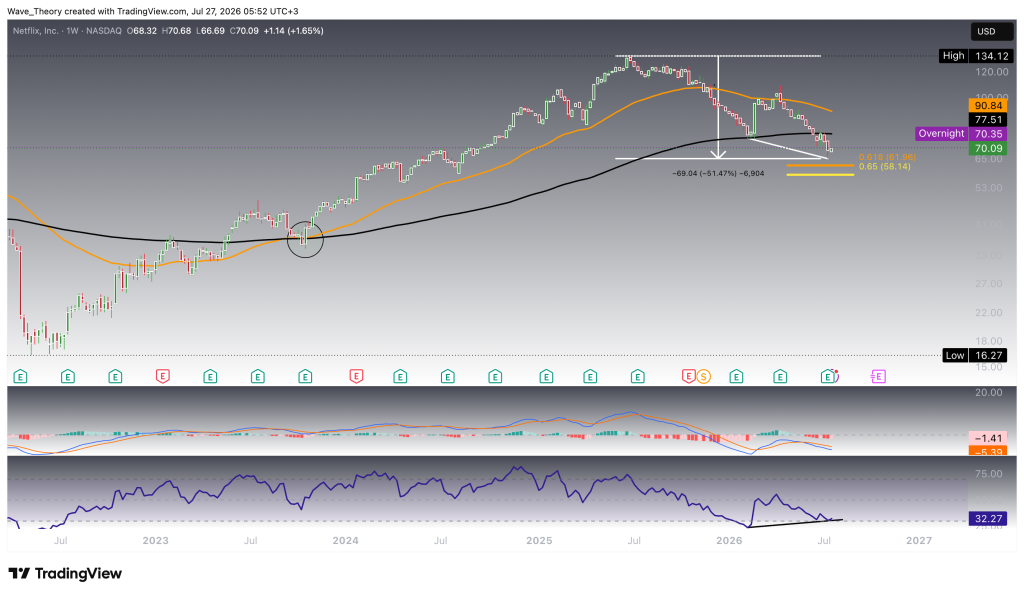
The weekly chart paints a more bullish picture as Netflix indicates a mix of bullish signals. The EMAs continue exhibiting a golden crossover, confirming that the broader medium-term trend has not yet fully reversed. While the MACD lines are bearishly crossed the histogram starts to tick bullishly higher this week.
Particularly bullish, however, is the confluence between the Golden Ratio support zone at $58.14–$61.96 and a massive bullish divergence on the weekly RSI. This combination significantly increases the probability of a strong bullish reversal from the current support region.
Price is about to be testing the Golden Ratio support between $58.14 and $61.96 after losing both the 50-week EMA and the 200-week EMA. This makes the current region especially important. Holding above this support could produce a meaningful recovery, whereas a decisive breakdown would likely accelerate downside momentum.
Daily Chart Suggests a Relief Rally Could Be Developing
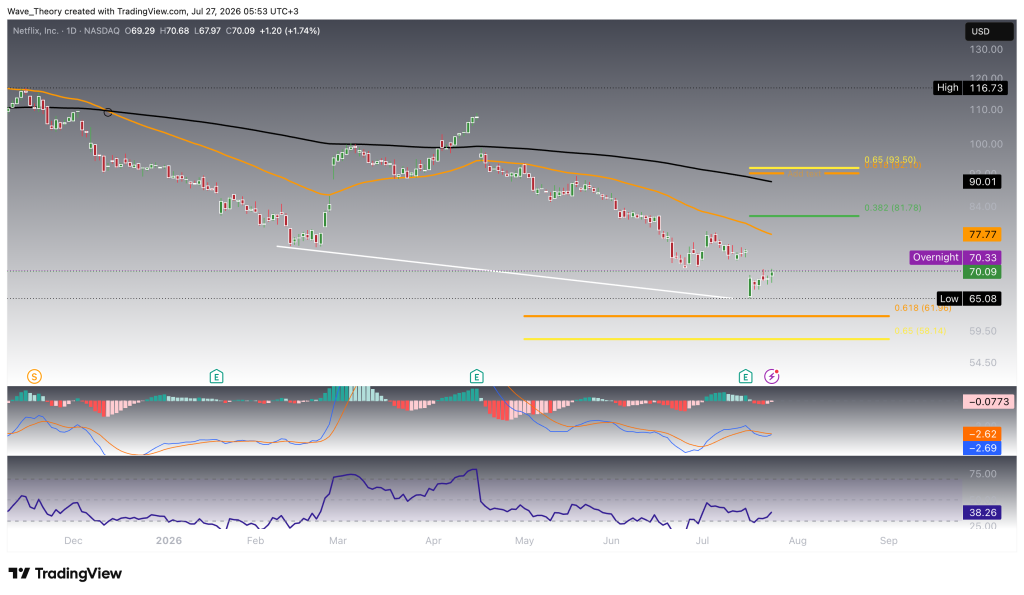
On the daily timeframe, Netflix has started showing the first signs of stabilization after successfully holding above the Golden Ratio support between $58.14 and $61.96. The RSI has formed a bullish divergence after which the price already surged from $65 to $70.
The next major resistance now awaits at the 0.382 Fibonacci retracement around $81.78. Above that, the next significant resistance zone lies between the Golden Ratio levels at $92.10 and $93.50. A recovery through these levels would substantially improve the medium-term outlook and could shift momentum back in favor of the bulls.
The MACD remains mixed. Although the MACD lines are still bearishly crossed, the histogram has started ticking higher again, indicating that bearish momentum is fading. The RSI remains in neutral territory, leaving sufficient room for additional upside if buyers continue defending current support.
The daily EMAs continue displaying a death cross, confirming that the short- to medium-term trend remains bearish despite the recent rebound.
Netflix Attempts to Build a Short-Term Base on the 4H Chart
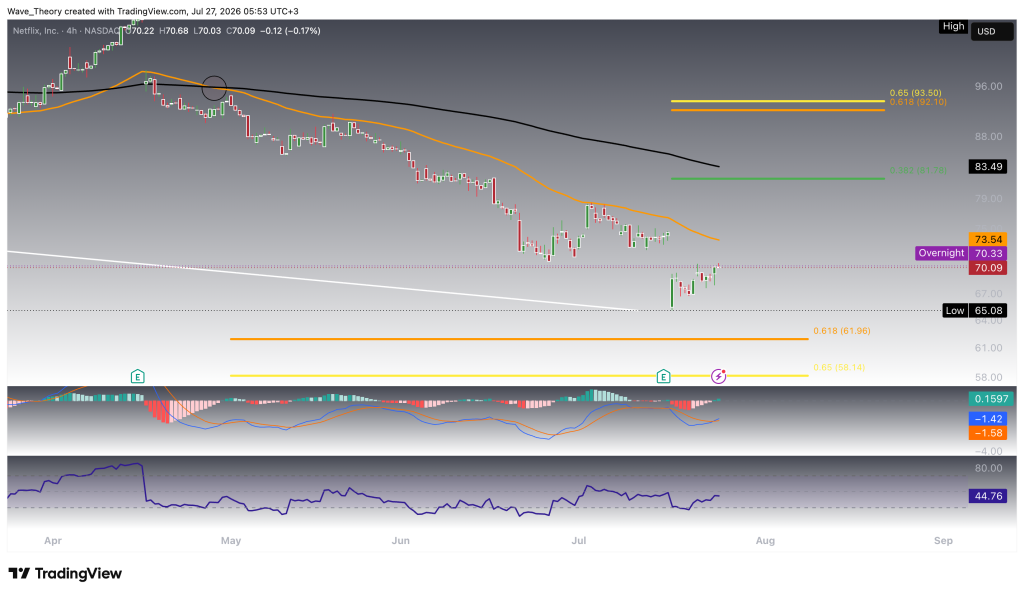
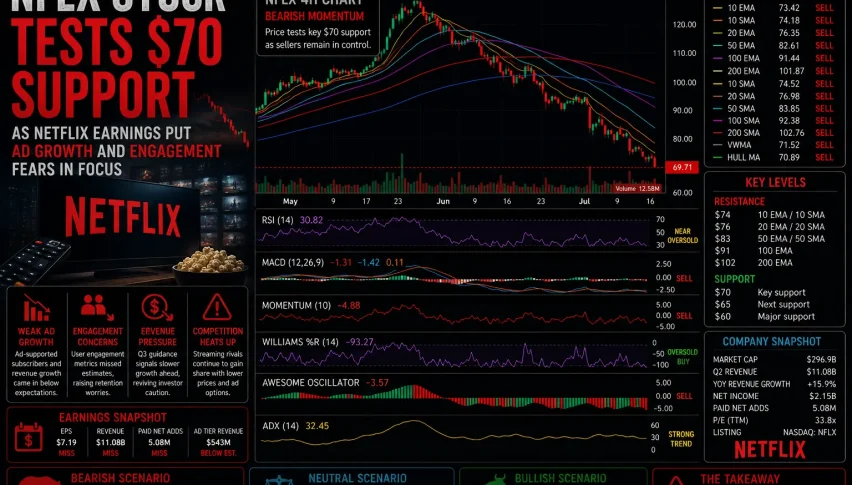
On the 4-hour chart, Netflix recently faced bearish rejection at the 50-4H EMA around $73.54, preventing the stock from extending its short-term recovery.
Immediate resistance remains at the 0.382 Fibonacci level around $81.78, followed by the Golden Ratio resistance zone between $92.10 and $93.50. Only a sustained breakout above these levels would signal that the broader correction has likely ended.
The MACD has started improving on the lower timeframe. The MACD lines are approaching a bullish crossover while the histogram continues ticking higher, reflecting improving short-term momentum. The RSI remains in neutral territory, suggesting there is room for additional upside before momentum becomes overheated.
However, the EMAs continue exhibiting a death cross, confirming that the short-term trend remains bearish until price can reclaim the key moving averages.
Netflix (NFLX) Price Prediction: Summary
Netflix remains one of the strongest long-term growth companies in the market, but technically the stock is currently undergoing its largest correction since the 2022 bear market.
The Golden Ratio support between $58.14 and $61.96 now represents the decisive level to watch across multiple timeframes. As long as this region holds, the long-term bullish structure remains intact despite weakening momentum.
On the upside, the first major resistance sits at the 0.382 Fibonacci level around $81.78, followed by the Golden Ratio resistance between $92.10 and $93.50. A recovery above these levels would significantly strengthen the bullish outlook and increase the probability of another attempt toward the all-time high at $134.12.
For now, the higher timeframes continue displaying golden crossovers, confirming that the broader long-term trend remains bullish, while the lower timeframes still exhibit death crosses, reflecting the ongoing correction. The battle between these conflicting signals makes the current Fibonacci support one of the most important technical levels for Netflix in the coming weeks.
- Check out our free forex signals
- Follow the top economic events on FX Leaders economic calendar
- Trade better, discover more Forex Trading Strategies
- Open a FREE Trading Account
- Read our latest reviews on: Avatrade, Exness, HFM and XM

Related Articles

Sidebar rates

Related Posts
 Save
SaveAva