Meta Stock Crashes 27% – Key Setup for a Strong Relief Rally?
Quick overview
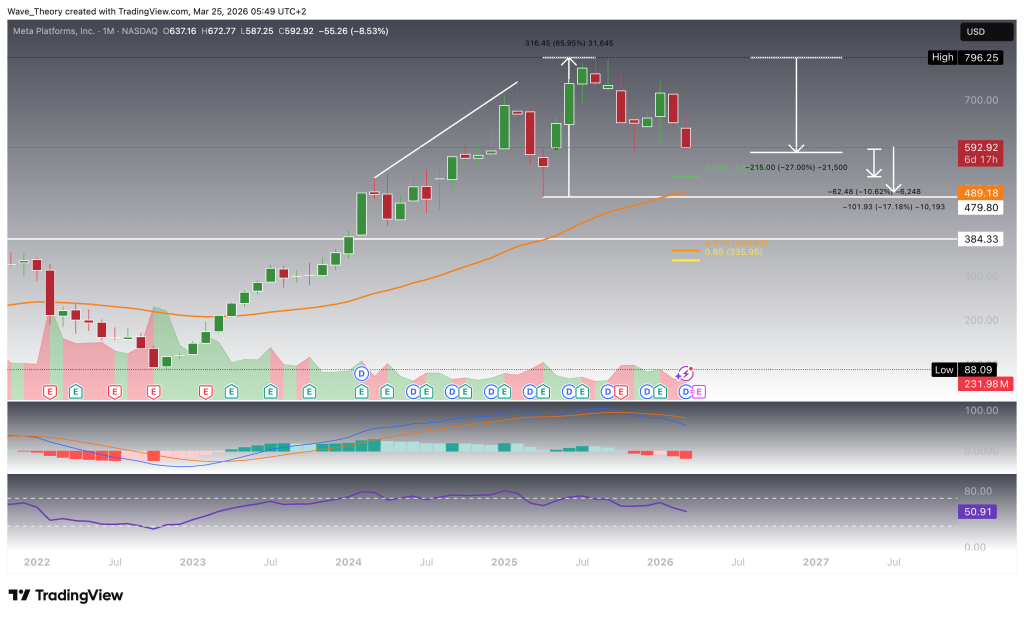
- Meta stock has experienced a significant correction of approximately 27% over the past eight months after a 66% rally.
- The stock is likely to decline further towards the 0.382 Fibonacci support at $525, indicating an additional downside potential of around 11%.
- Key support levels include $581-$600 for short-term reactions and $500 as major structural support, while resistance is found at $720.
- The technical outlook remains predominantly bearish, but a bullish reaction at critical support levels could initiate a relief rally.
Meta Faced Rejection at the Golden Ratio Resistance
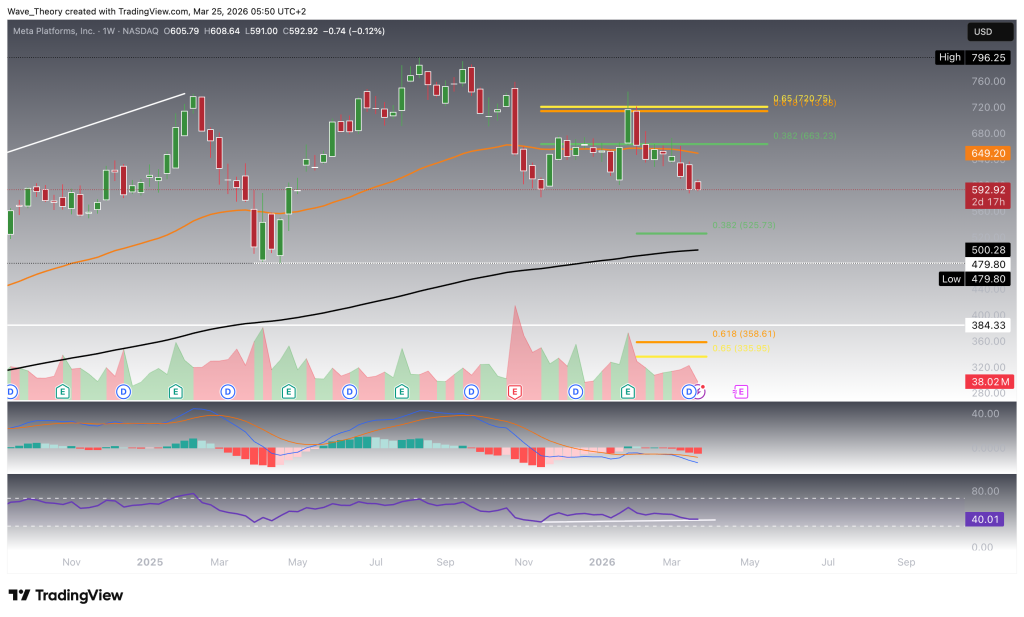
Following its most recent bullish rebound, Meta rallied strongly into the Golden Ratio resistance at $720, where it encountered a sharp rejection, reinforcing the prevailing corrective structure. As long as META fails to break decisively above this critical $720 resistance, the stock remains firmly within its ongoing correction phase. In the aftermath of the rejection, price has fallen significantly below the 50-week EMA, shifting the technical landscape. The 0.382 Fibonacci level at $663, together with the 50-week EMA at $649, now acts as a key resistance zone on any upward attempts.
From a downside perspective, a continuation of the correction toward the 0.382 Fibonacci support at $525 appears increasingly likely. Slightly below, the 200-week EMA at $500 provides an additional layer of structural support, reinforcing this region as a potential demand zone.
On the weekly timeframe, indicators present a mixed outlook. The MACD lines are bearishly crossed, and the MACD histogram continues to trend lower, signaling persistent downside momentum. However, the EMAs still maintain a golden crossover, confirming that the broader mid-term trend remains bullish despite the ongoing correction. Meanwhile, the RSI shows early signs of a potential bullish divergence, particularly if META dips slightly below its previous low at $581, which could indicate weakening bearish momentum and set the stage for a potential reversal.
Similar Outlook on the 4H Chart
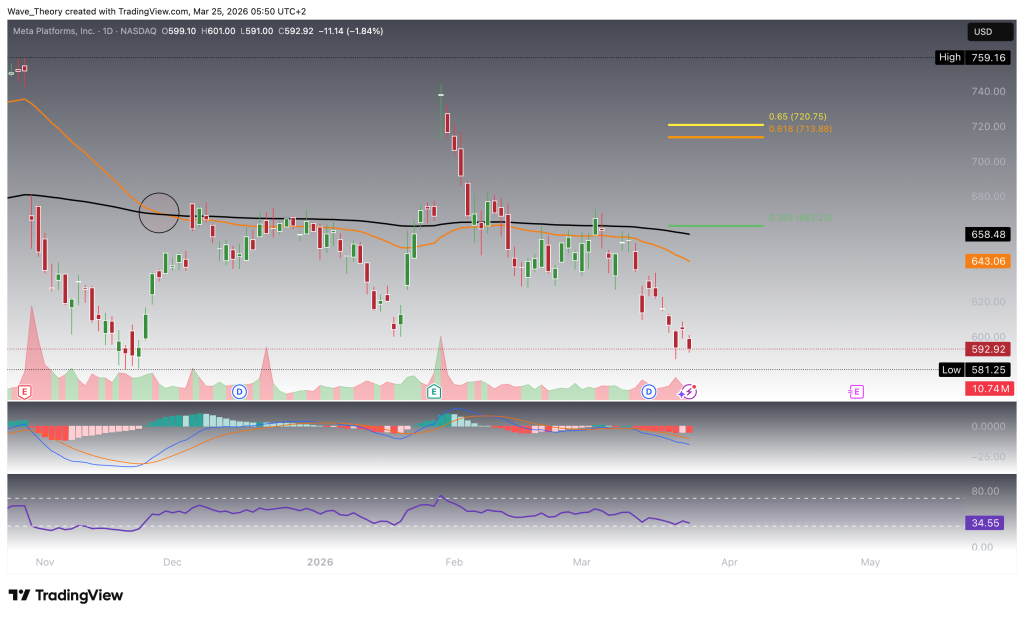
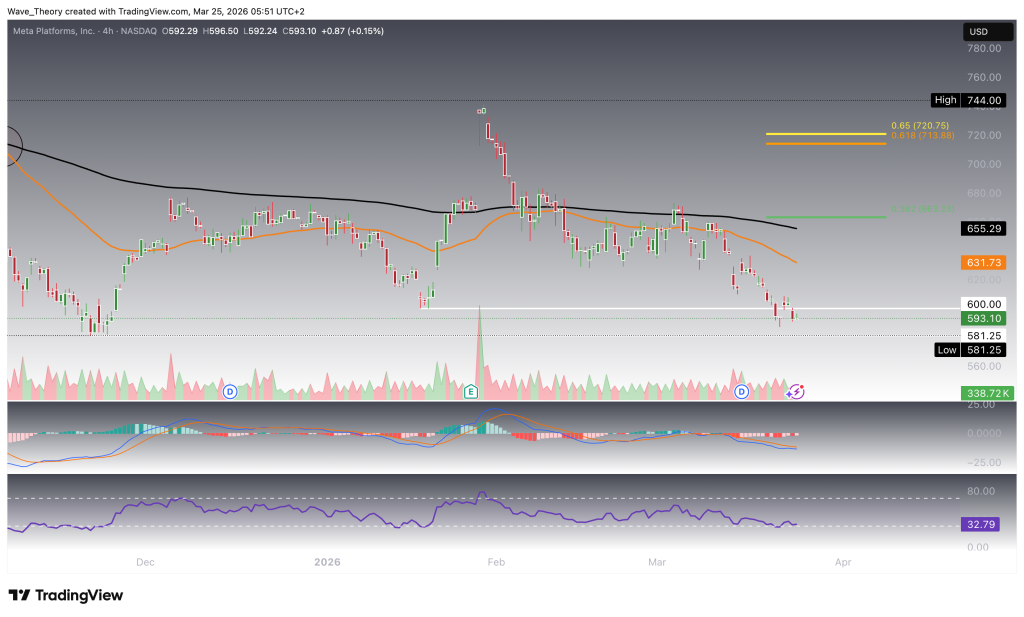
On the 4-hour chart, Meta continues to reflect a bearish short-term structure, with the EMAs forming a death cross that confirms the prevailing downtrend. Momentum indicators remain mixed but lean bearish overall. The RSI provides no clear directional signal, remaining neutral and lacking momentum confirmation on either side.
Meanwhile, the MACD lines are still bearishly crossed, reinforcing the current downside bias. However, the MACD histogram has started to trend higher, indicating a gradual loss of bearish momentum and raising the possibility of an impending bullish crossover.
In the near term, META finds a key support zone between $581 and $600. This region could act as a base for a short-term bullish reaction, and while the broader trend remains bearish, a relief bounce from this support zone cannot be ruled out.
Meta Stock at Key Support – Critical Levels to Watch
Meta remains in a prolonged corrective phase across multiple timeframes, with bearish momentum dominating in the short- to mid-term. Repeated rejections at key resistance levels—most notably the Golden Ratio at $720—combined with death crosses on lower timeframes and weakening MACD momentum, reinforce the current downtrend. However, the broader structure still retains a bullish undertone, supported by higher timeframe EMA positioning and potential bullish divergence signals.
Key support levels:
- $581–$600 – Short-term support zone (4H)
- $525 – 0.382 Fibonacci support (primary downside target)
- $500 – 200-week EMA (major structural support)
- $489 – 50-month EMA (historical support zone)
Key resistance levels:
- $629 and $700 – First Fib resistance (if bullish bounce at $525)
- $649–$663 – 50-week EMA + 0.382 Fib resistance cluster
- $720 – Golden Ratio (trend-defining level if price doesn’t drop below last low)
Scenario:
- Continued weakness toward $525 remains the most likely path, with ~11% downside potential.
- A bullish reaction at this level could trigger a rebound toward $629 and $700.
- Only a confirmed breakout above $720 ($700) would invalidate the correction and re-establish a strong bullish trend.
Bottom line:
Meta is approaching a high-probability reaction zone, where the next move—either a deeper breakdown or a relief rally—will define the medium-term trend.
- Check out our free forex signals
- Follow the top economic events on FX Leaders economic calendar
- Trade better, discover more Forex Trading Strategies
- Open a FREE Trading Account
- Read our latest reviews on: Avatrade, Exness, HFM and XM
Related Articles


Sidebar rates
Related Posts
