Robinhood Surges 3% on IPO Ambitions as $377B Asset Base Powers Growth Beyond Trading
HOOD stock: Robinhood stock HOOD gains over 3% after IPO underwriting approval as assets hit $377B and customer growth accelerates.

Quick overview
- Robinhood is transitioning from a retail trading platform to a broader financial services company, recently gaining approval to underwrite IPOs.
- The company's stock rose over 3% amid strong operating metrics and growing investor interest, despite remaining below its 2025 highs.
- Robinhood is diversifying its offerings with AI-powered tools, prediction markets, and expanded crypto products to enhance customer engagement.
- While the stock shows bullish technical signals, risks such as regulatory challenges and market volatility remain.
Robinhood Markets (NASDAQ: HOOD) is attempting to redefine itself from a retail trading platform into a broader financial services and capital markets company.
The stock rose more than 3% after the company disclosed that its securities division received regulatory approval to underwrite initial public offerings, opening a potentially lucrative new revenue stream just as the U.S. IPO market shows renewed momentum.
The development comes alongside strong operating metrics, growing platform assets, expanding product offerings, and continued investor interest in Robinhood’s long-term growth strategy.
Yet despite the recent rally, the stock remains well below its 2025 highs as investors balance growth opportunities against regulatory risks and valuation concerns.
Robinhood Expands Beyond Retail Trading
Robinhood’s latest approval allows the company to move beyond simply distributing IPO shares to retail investors.
The brokerage can now participate directly in underwriting transactions, positioning itself alongside traditional Wall Street firms.
The move arrives at a potentially favorable time:
- IPO activity is accelerating
- Retail investor participation remains elevated
- Robinhood continues expanding into new financial products
- Large technology listings could drive future demand
Management has increasingly focused on broadening the platform beyond commission-free stock trading.
Recent initiatives include:
- AI-powered trading tools
- Prediction markets
- Expanded crypto offerings
- Retirement products
- Institutional partnerships
- IPO underwriting capabilities
The strategy aims to diversify revenue while deepening customer engagement.
Strong Operating Metrics Continue Supporting Robinhood’s Growth
Recent May operating data highlighted continued platform expansion.
Key metrics included:
| Metric | Latest Result |
|---|---|
| Platform Assets | $377 Billion |
| YoY Asset Growth | 48% |
| Funded Customers | 27.7 Million |
| Monthly Net Deposits | $5.6 Billion |
| Market Cap | ~$78 Billion |
| Revenue Growth (TTM) | 41.5% |
The company also reported:
- Record equities trading volume
- Record prediction market activity
- Strong options trading
- Record margin balances
Several analysts subsequently raised price targets following the update.
Truist reiterated a Buy rating with a $100 target, citing favorable long-term risk-reward characteristics.
AI, Prediction Markets, and Capital Markets Create Multiple Growth Engines
Robinhood increasingly resembles a fintech platform rather than a pure brokerage.
Several emerging growth drivers are attracting investor attention:
- Capital Markets Expansion: IPO underwriting creates access to higher-fee revenue opportunities that historically belonged to larger investment banks.
- AI Trading Tools: Robinhood recently introduced AI-powered investing features designed to improve user engagement and platform stickiness.
- Prediction Markets: The company’s push into prediction markets may open new forms of event-based trading and speculation.
- Crypto Ecosystem: Although crypto volumes remain softer than previous cycles, Robinhood continues investing heavily in digital asset infrastructure.
The combination provides multiple potential growth vectors beyond traditional equity trading.
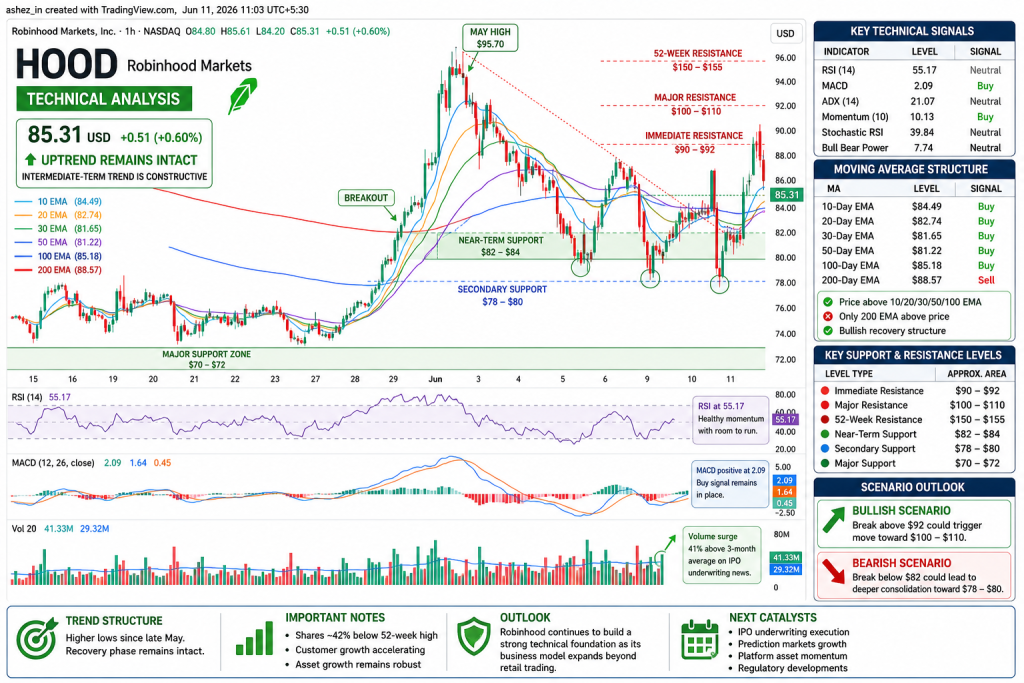
Robinhood (HOOD) Technical Analysis: Uptrend Remains Intact
Technically, Robinhood remains in a constructive intermediate-term trend despite remaining significantly below its 2025 peak.
The stock has gained roughly 12% over the past month and continues to outperform many fintech peers.
Key Technical Signals
| Indicator | Level | Signal |
|---|---|---|
| RSI (14) | 55.17 | Neutral |
| MACD | 2.09 | Buy |
| ADX | 21.07 | Neutral |
| Momentum (10) | 10.13 | Buy |
| Stochastic RSI | 39.84 | Neutral |
| Bull Bear Power | 7.74 | Neutral |
The indicator mix leans bullish, with MACD and Momentum both generating buy signals.
Moving Average Structure
| Moving Average | Level | Signal |
|---|---|---|
| 10-Day EMA | $84.49 | Buy |
| 20-Day EMA | $82.74 | Buy |
| 30-Day EMA | $81.65 | Buy |
| 50-Day EMA | $81.22 | Buy |
| 100-Day EMA | $85.18 | Buy |
| 200-Day EMA | $88.57 | Sell |
Robinhood trades above its 10-day, 20-day, 30-day, 50-day, and 100-day moving averages.
Only the 200-day EMA remains above current prices.
This setup typically reflects a stock transitioning from recovery mode toward a more established uptrend.
RSI and MACD
RSI (14) stands at 55.17, indicating healthy momentum without approaching overbought territory. The reading suggests buyers maintain control while leaving room for additional upside.
MACD remains positive at 2.09 and continues flashing a buy signal. Momentum has improved following the recent breakout, indicating buyers are regaining control after months of consolidation.
Together, the indicators favor continuation of the recovery trend rather than a major reversal.
Volume and Trend Structure
Robinhood’s recent advance has been supported by above-average trading volume.
The underwriting announcement generated volume approximately 41% above the three-month average, signaling strong investor interest.
Importantly:
- Shares remain roughly 42% below their 52-week high
- Customer growth continues accelerating
- Asset growth remains robust
- Technical structure has improved materially since early 2026
The chart currently resembles a recovery phase rather than a fully mature bull cycle.
Key Support and Resistance Levels for HOOD Stock
| Level Type | Approximate Area |
|---|---|
| Immediate Resistance | $90-$92 |
| Major Resistance | $100-$110 |
| 52-Week Resistance | $150-$155 |
| Near-Term Support | $82-$84 |
| Secondary Support | $78-$80 |
| Major Support | $70-$72 |
A sustained breakout above $92 would strengthen the bullish technical setup and increase the probability of a move toward the $100-$110 region.
Conversely, a break below $82 could trigger renewed consolidation.
Is Robinhood Building a Financial Super App?
Robinhood’s long-term investment case increasingly depends on platform diversification rather than trading activity alone.
Bullish investors point to:
- 27.7 million funded accounts
- $377 billion in platform assets
- Strong deposit growth
- New underwriting revenue opportunities
- Expanding AI capabilities
- Prediction market growth
The biggest risks remain:
- Regulatory intervention
- Slower retail trading activity
- Crypto market volatility
- Elevated valuation multiples
- Competition from larger financial institutions
For now, however, Robinhood appears to be successfully evolving beyond its origins as a commission-free brokerage. If management continues executing across capital markets, AI tools, and financial services, the company could emerge as one of the most diversified consumer fintech platforms in the market.
- Check out our free forex signals
- Follow the top economic events on FX Leaders economic calendar
- Trade better, discover more Forex Trading Strategies
- Open a FREE Trading Account
- Read our latest reviews on: Avatrade, Exness, HFM and XM
Related Articles


Sidebar rates
Related Posts
