Palantir Stock (PLTR) Down 41%: Is More Downside Ahead?

Quick overview
- Peter Thiel's relocation to Argentina and ties with President Javier Milei have garnered media attention, but Palantir's performance remains the focal point for investors.
- Palantir's stock has declined approximately 41% from its peak, with critical support at $125.40 being defended by buyers.
- Technical indicators show a bearish trend, with death crosses on multiple charts and momentum favoring the bears, although a recovery remains possible if support holds.
- Key resistance levels to watch are at $139.60, $146.30, and $178, with a breakout above $178 potentially reversing the current bearish structure.
Palantir co-founder and chairman Peter Thiel has recently dominated headlines following reports that he relocated his family to Argentina, deepening his ties with Argentine President Javier Milei and purchasing a high-profile estate in Buenos Aires. For investors, however, the bigger story remains Palantir itself. The company sits at the intersection of two of the most powerful trends in modern markets: artificial intelligence and national security. As governments and enterprises race to deploy AI at scale, Palantir has emerged as one of the few companies capable of translating cutting-edge technology into real-world operational advantages. The result has been explosive revenue growth, expanding profitability, and one of the strongest stock market performances of the current cycle.
Historical Support at $125 Keeps Palantir Bulls in the Game
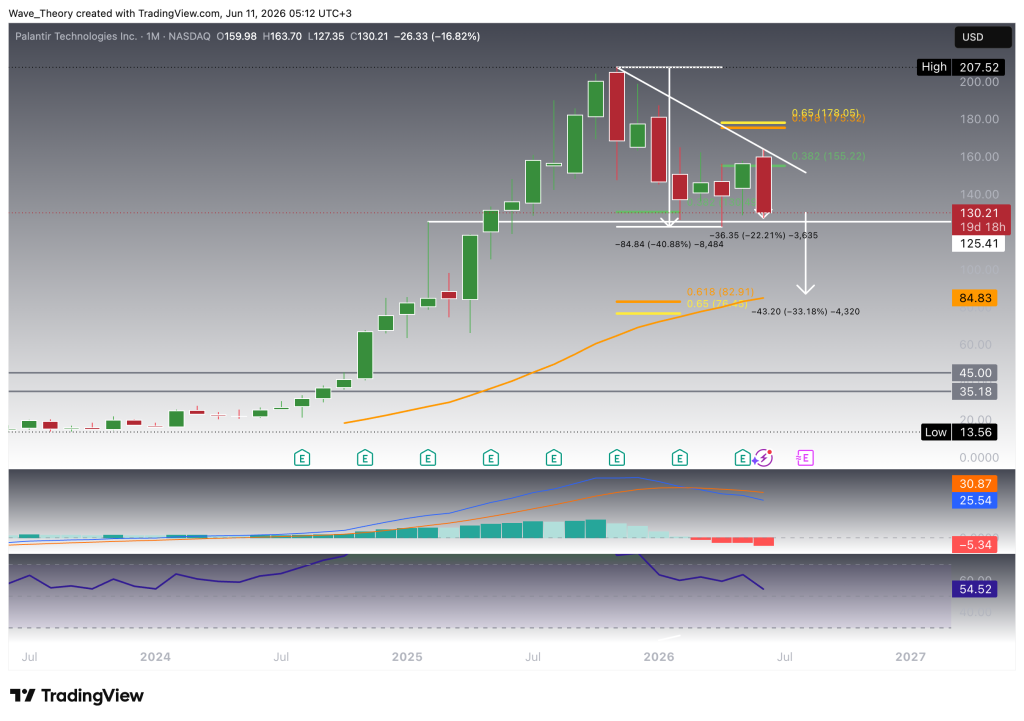
Palantir (PLTR) has endured a sharp correction over the past seven months, with the stock declining approximately 41% from its peak. Despite the significant drawdown, buyers continue to defend the critical support zone around $125, a level that has repeatedly triggered bullish rebounds and remains the most important floor in the current market structure.
To the upside, the next major hurdles are the Fibonacci resistance levels at $155 and $178. The latter represents the golden ratio resistance and serves as the key line in the sand for the ongoing corrective phase. As long as Palantir remains below $178, the broader correction remains intact. However, a decisive breakout above this level would invalidate the current bearish structure and potentially open the door for a retest of the all-time high at $207.50, with the possibility of extending into new record territory.
Momentum indicators continue to favor the bears for now. The MACD lines remain bearishly crossed, while the MACD histogram continues to trend lower, reflecting persistent downside momentum. Meanwhile, the RSI remains in neutral territory, indicating that neither bulls nor bears have yet established a decisive momentum advantage. Collectively, the indicators suggest that despite the strong support at $125, the technical picture remains tilted to the downside until key resistance levels are reclaimed.
Lower Highs and Lower Lows Continue to Define the Weekly Trend
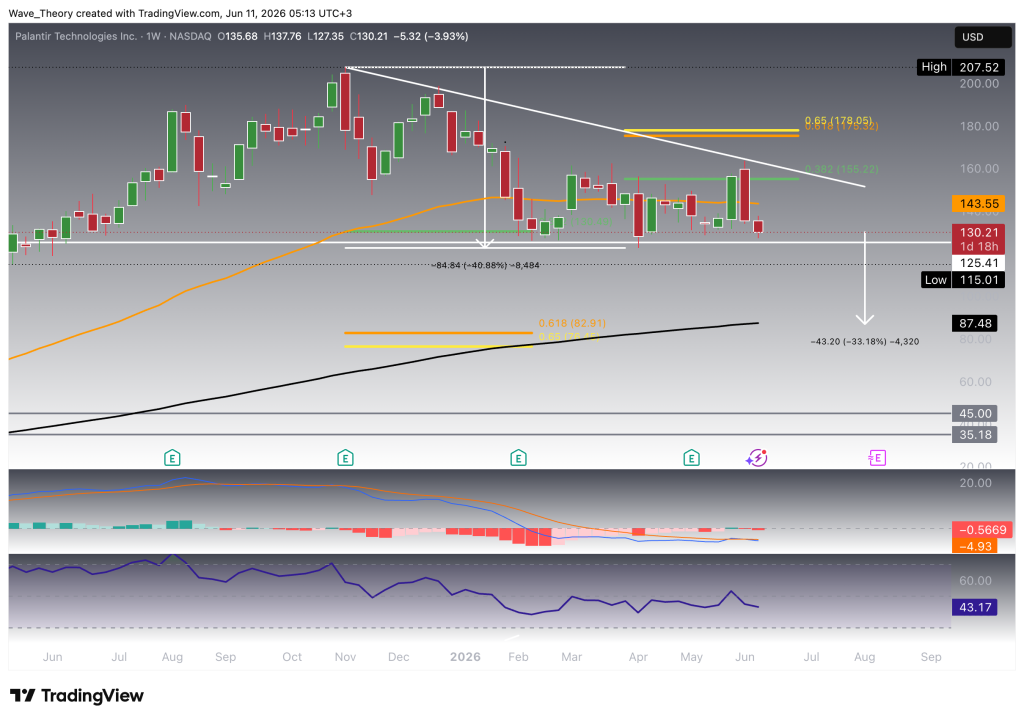
The weekly chart continues to paint a cautious picture for Palantir. While the moving averages still maintain a bullish structure, with the EMAs preserving a golden crossover that confirms the mid-term uptrend, price action itself remains characterized by a series of lower highs and lower lows since the peak, underscoring the ongoing corrective phase.
Momentum indicators continue to favor the bears. The MACD lines remain bearishly crossed, while the MACD histogram has been ticking lower for several consecutive weeks, signaling persistent downside momentum. Meanwhile, the RSI remains in neutral territory, reflecting a lack of strong bullish conviction despite the stock’s recent attempts to stabilize.
The key level to watch remains the historical support zone around $125.40. This area has repeatedly attracted buyers and currently serves as the final line of defense for the broader bullish structure. However, should Palantir break decisively below this support, the correction could accelerate toward the 200-week EMA near $87.50. Additional support lies at the golden ratio retracement level around $80, which represents a major long-term Fibonacci support zone.
A move from current levels to the $80–87.50 region would imply additional downside of approximately 33.2%, highlighting the significance of the $125.40 support and the risk of a much deeper retracement should it fail to hold.
Death Cross on the Daily Chart Keeps Pressure on Palantir Stock
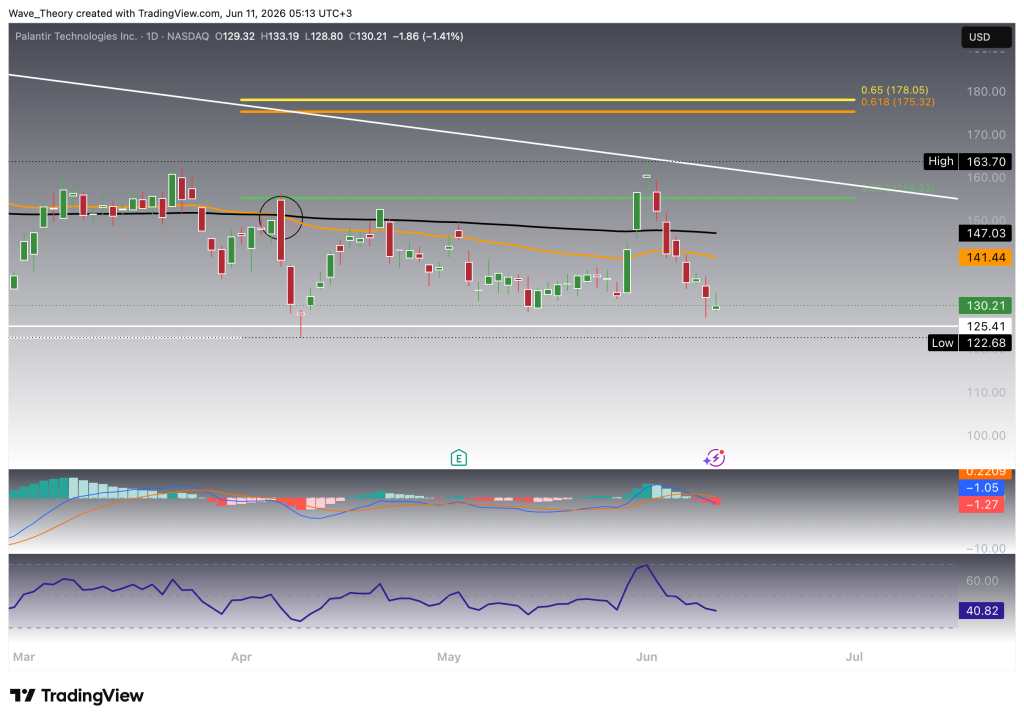
The daily chart continues to favor the bears. Most notably, the EMAs have formed a death cross, a bearish technical signal that confirms the trend to the downside across the short- to medium-term timeframe. This development reinforces the broader corrective structure that has dominated Palantir’s price action in recent months.
Momentum indicators remain equally cautious. The MACD lines are bearishly crossed, while the MACD histogram continues to print lower readings, indicating that downside momentum remains firmly intact. At the same time, the RSI is hovering in neutral territory, suggesting that the stock is neither oversold nor showing signs of a meaningful bullish reversal.
For now, the technical picture remains tilted to the downside. However, as long as Palantir continues to hold above the critical support zone at $125.40, the bullish case cannot be ruled out entirely. A sustained defense of this level could provide the foundation for a recovery attempt, whereas a decisive breakdown would likely expose the stock to significantly deeper retracement targets.
Palantir Stock Analysis Summary & Key Levels
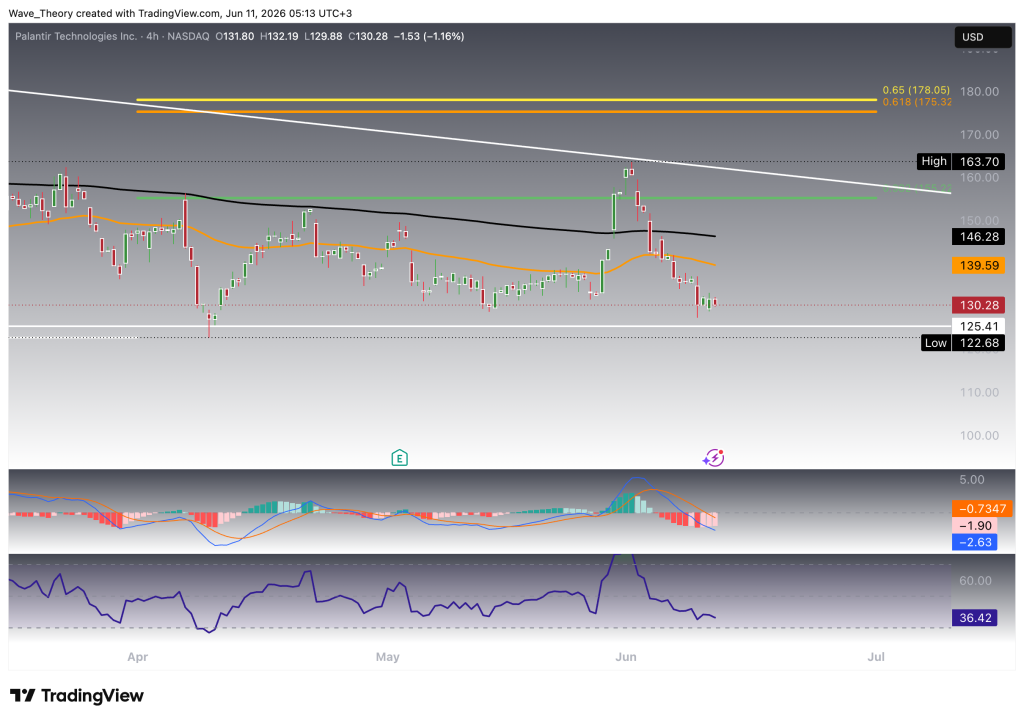
Palantir (PLTR) remains in a corrective phase after falling roughly 41% from its highs over the past seven months. The weekly, daily, and 4-hour charts continue to show a pattern of lower highs and lower lows. Momentum indicators also favor the bears. Both the daily and 4-hour charts display death crosses, while the MACD remains bearishly aligned across multiple timeframes.
Despite the weakness, Palantir continues to hold above the critical support zone at $125.40. This level has repeatedly attracted buyers and remains the most important support on the chart. As long as it holds, the possibility of a recovery remains alive. However, a decisive break below $125.40 could accelerate the correction. In that scenario, the next major downside targets are the 200-week EMA at $87.50 and the golden ratio support near $80. Such a move would imply additional downside of approximately 33%.
On the upside, immediate resistance is found at the 4-hour EMA cluster near $139.60 and $146.30. Beyond that, major Fibonacci resistance levels sit at $155 and $178. The $178 golden ratio resistance is particularly important. A sustained breakout above this level would invalidate the broader correction and shift the technical outlook back in favor of the bulls. If achieved, Palantir could target its all-time high at $207.50 and potentially move into new record territory.
For now, Palantir remains trapped between major support and resistance. The bears maintain the technical advantage, but the bulls continue to defend the crucial $125.40 support zone. The next decisive move will likely be determined by which of these key levels breaks first.
- Check out our free forex signals
- Follow the top economic events on FX Leaders economic calendar
- Trade better, discover more Forex Trading Strategies
- Open a FREE Trading Account
- Read our latest reviews on: Avatrade, Exness, HFM and XM
Related Articles


Sidebar rates
Related Posts
