Gold Price Analysis: XAU/USD Faces $4,050 Triple-Top Rejection After ECB Holds; Quick Trade Idea
Gold price retreated from $4,160 to $4,050 following a third rejection of the $4,185 triple-top. The European Central Bank (ECB)...
Quick overview
- Gold prices fell from $4,160 to $4,050 after facing resistance at the $4,185 triple-top for the third time.
- The European Central Bank maintained its deposit rate at 2.25%, with market focus shifting to Lagarde's upcoming press conference.
- Current economic indicators suggest a resilient US economy, making it unlikely for the Federal Reserve to lower rates soon, which negatively impacts gold prices.
- Gold is currently trading within a symmetrical triangle pattern, with immediate support at $4,036 and resistance at $4,185.
Gold price retreated from $4,160 to $4,050 following a third rejection of the $4,185 triple-top. The European Central Bank (ECB) maintained its deposit rate at 2.25%, as widely anticipated, with Lagarde’s press conference remaining the sole event left on the agenda for the day. At present, Treasury bonds yielding 4.6% and a strengthening dollar are playing a mechanical role in suppressing gold prices, a phenomenon that has persisted all month.
Why Gold Reversed From $4,160 to $4,050
Gold briefly reached $4,160 during the Asian and early European trading sessions, its highest level since July 7, as Trump issued simultaneous statements regarding strikes on Iran and disruptions to the Houthis’ activities in the Red Sea. This generated a pure safe-haven bid. This was not the inflation trade linked to soaring oil prices that drove gold down in May and June. However, the triple-top at $4,185 held for the third time.
The failure at $4,185 isn’t accidental. The fact that the price has tested this resistance level three separate times over the past two weeks, each time leading to a pullback, suggests institutional sellers are actively present at that level. Gold must convincingly close above $4,185 on high volume before the $4,185 zone becomes favorable for buyers attempting a breakout, rather than sellers defending the price.
The long-term downtrend line, which is trending downwards on the four-hour chart, offers resistance at $4,148, followed by $4,200, and finally $4,246. The 50-period Exponential Moving Average (EMA) at $4,068 and the 100-period EMA at $4,083 provide some dynamic support from below. Price is currently trading beneath the 50-period EMA at $4,065, shifting the short-term bias from constructive to conservative.
June retail sales rose by 0.2%, the core measure increased by 0.5%, and jobless claims for last week fell to 208,000. These are further signs of a resilient US economy, reducing the likelihood that the Federal Reserve will lower rates in the near future. With the CME FedWatch tool showing an 85.6% probability that the Fed will hold rates between 3.50% and 3.75% in July, it is difficult to imagine Treasuries at 4.6% and gold at 0% allowing the metal’s price to rise significantly.
Gold (XAU/USD) Technical Analysis: $4,036 Is the Line Between Consolidation and Deeper Decline
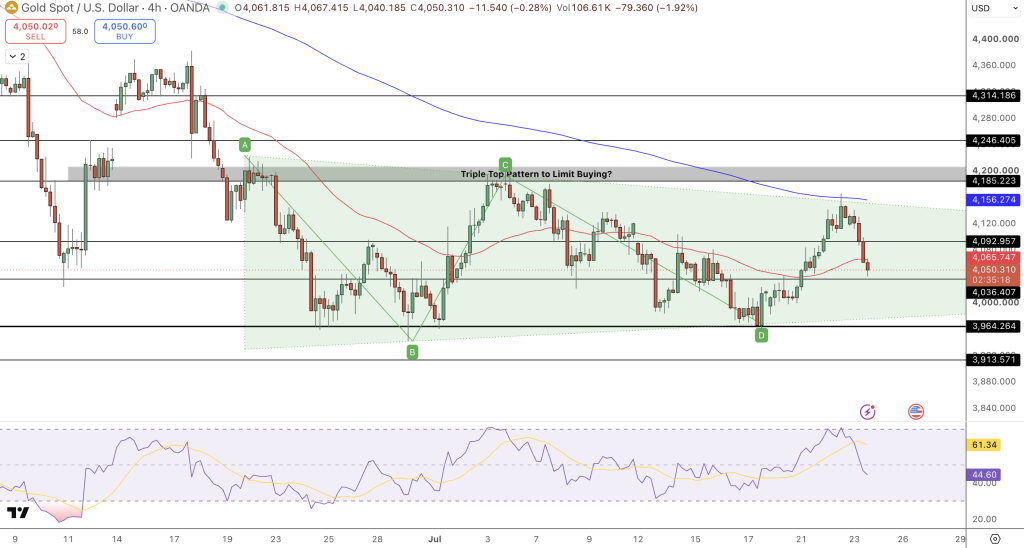
The chart depicts a strong rejection from the $4,185 triple-top zone. The Relative Strength Index (RSI) is at 44.6 and falling through its signal line, which represents the first momentum-based sell signal since gold broke out above the $3,964 triple-bottom.
Resistance: $4,093 (reclaiming this level is vital to maintain a bull market view) → $4,185 (triple-top, where gold has been rejected three times in two weeks) → $4,246 (target should $4,185 level break out).
Support: $4,036 (immediate support level; a break below this level exposes $3,964, the triangle’s base) → $3,964 (triangle’s base: a three-week triple-bottom foundation).
Primary Structure: Gold is trapped within a large symmetrical triangle. The base of the triangle is at $3,964 (triple-bottom), while $4,185 (triple-top) represents the ceiling. The triangle needs to resolve, likely next week when the FOMC meets.
Trade Setup: Buy only if gold closes above $4,093 on the daily timeframe | Targets: $4,185 → $4,246 | Stop loss below $3,964. Bias: Neutral. Awaiting Lagarde and FOMC decision before entering.
The Remaining Catalyst: What Lagarde’s Press Conference Does to Gold
As the European Central Bank decision to hold the interest rate at 2.25% had been fully priced in, the real time trading is now based on Lagarde’s comments on September.
The stronger Lagarde in terms of hawkishness (the inflation risks continue to be “tilted” on the upside, hinting at another hike in September), the stronger the euro and dollar slightly weaker, and gold a little better.
But the idea of the ECB’s September hike just reiterates that the world’s economy still has a higher for longer story, which is not very bullish for the gold price. On the other hand, Lagarde in a neutral or dovish tone (data-dependant with no sign of the next hike in September), dollar remains strong, gold stays within the $4,036 to $4,093 band throughout the day, and we have to wait for the July 29 FOMC for the main move.
The July 2026 gold price range is $3,365 to $4,236. In terms of the close, the LiteFinance Gold price forecast is to settle between $3,542 and $3,887. This shows that the current gold price level at $4,050 is close to the upper half of the projected range, but is still well within.
FAQ: Gold July 23 — Triple Top, ECB Impact, and the FOMC Setup
Why has gold failed three times at $4,185?
The $4,185 is the top line of the symmetrical triangle pattern gold has been trading inside since the end of June and also a horizontal resistance created back in July 7th to July 9th when gold was last trading above that level.
So if the triple tops are there then this confirms that the selling at that level is concentrated and it needs another, stronger event for the pattern to break as there is no supply being bought by demand yet.
Does the ECB hold at 2.25% help or hurt gold?
Well the fact that the interest rate has not moved is neutral as it had been already fully priced. However, it depends on the comments by Christine Lagarde. If she was more hawkish, this would strengthen the Euro and the dollar slightly weaker and it will help the price of gold which is quoted in dollar a little bit but it will also make the world economy still in a higher for longer environment and this is bad for gold.
What is the gold price outlook heading into the FOMC on July 29?
The Fed rate hike probability on CME FedWatch is still 85.6% for a July 29th rate unchanged, however, the actual FOMC decision is not the catalyst, the real story will be Warsh’s tone on September and the revised dot plot.
If the dot plot shows a higher median rate of 2026 rate forecast this will be extremely bearish for gold in the second half of July, the same happened in June when this rate rose to 3.8% from 3.4% in the first half of June but if the dot plot shows unchanged projections this would mean the end of the rate hikes which would give the right macro story for gold price to break the $4,185.
- Check out our free forex signals
- Follow the top economic events on FX Leaders economic calendar
- Trade better, discover more Forex Trading Strategies
- Open a FREE Trading Account
- Read our latest reviews on: Avatrade, Exness, HFM and XM

Related Articles



Sidebar rates

Related Posts
 Save
Save